
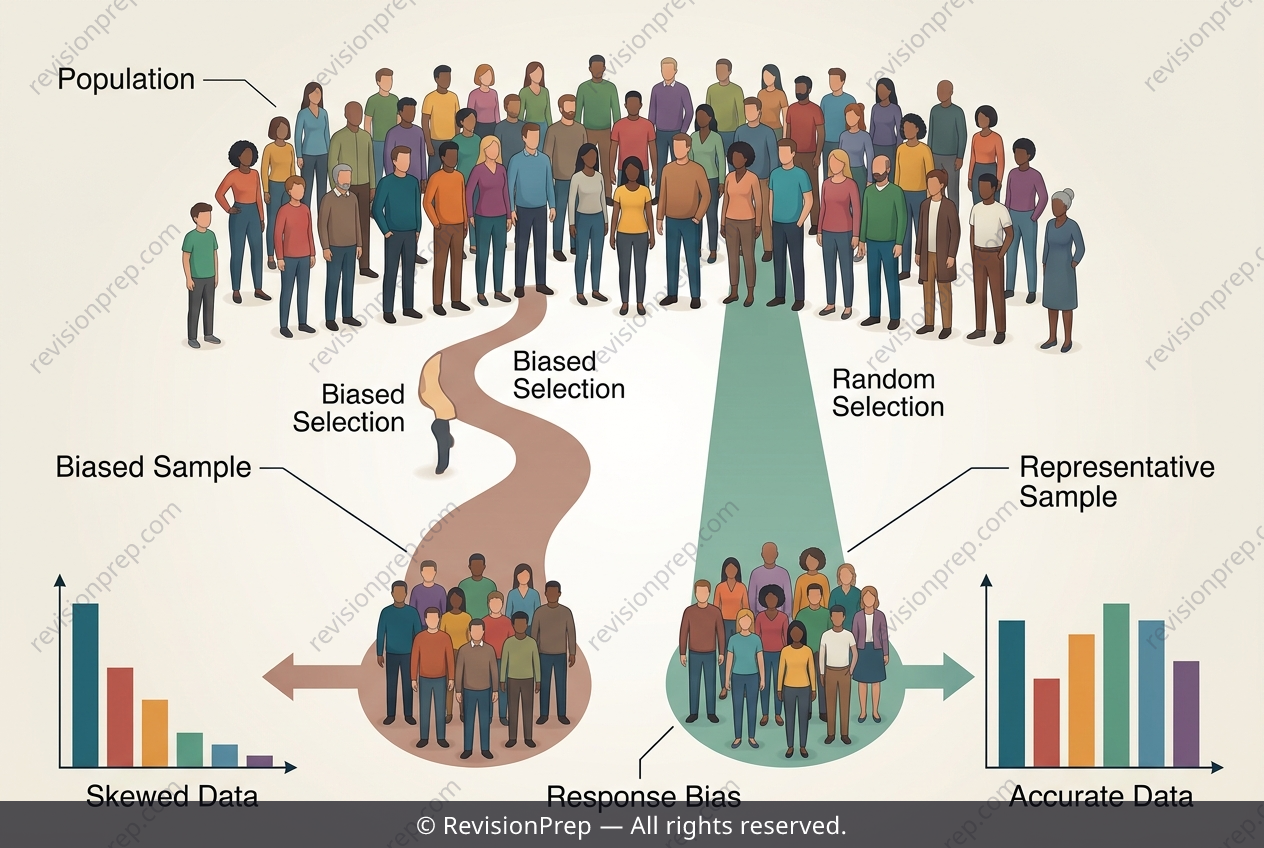
Maths: How Sampling Bias Distorts Statistical Results
Data is the raw material of all statistical analysis, but not all data is created equal. In mathematics, we classify information as either discrete or continuous: discrete data takes on distinct, separate values (like the number of homework hours a student claims to complete), while continuous data can take any value within a range (like the exact time spent, measured to the nearest second). However, the validity of any conclusion drawn from this data hinges entirely on how that data is collected—a flawed sample can render even the most precise measurements meaningless. This is where sampling bias enters the picture. If a teacher asks only the top maths class about homework hours, she introduces bias because that subgroup is not representative of all Year 7 students; their habits likely skew higher than the average. The core mechanism at play is that the sample’s distribution must mirror the population’s, otherwise the calculated mean (average) becomes a distorted reflection of reality. Random selection—giving every student an equal chance of being chosen—helps ensure representativeness, but even then, non-response can quietly reintroduce bias. Furthermore, the accuracy of the data itself depends on truthful responses; dishonest answers, whether from exaggeration or underreporting, directly corrupt the average, making it an invalid measure of the true central tendency. Understanding these connections—between data type, sampling method, and response validity—is essential for interpreting any statistical result with confidence.
Start practising IB questions today
150,000+ IB-styled questions, criteria-mapped and instantly accessible.