
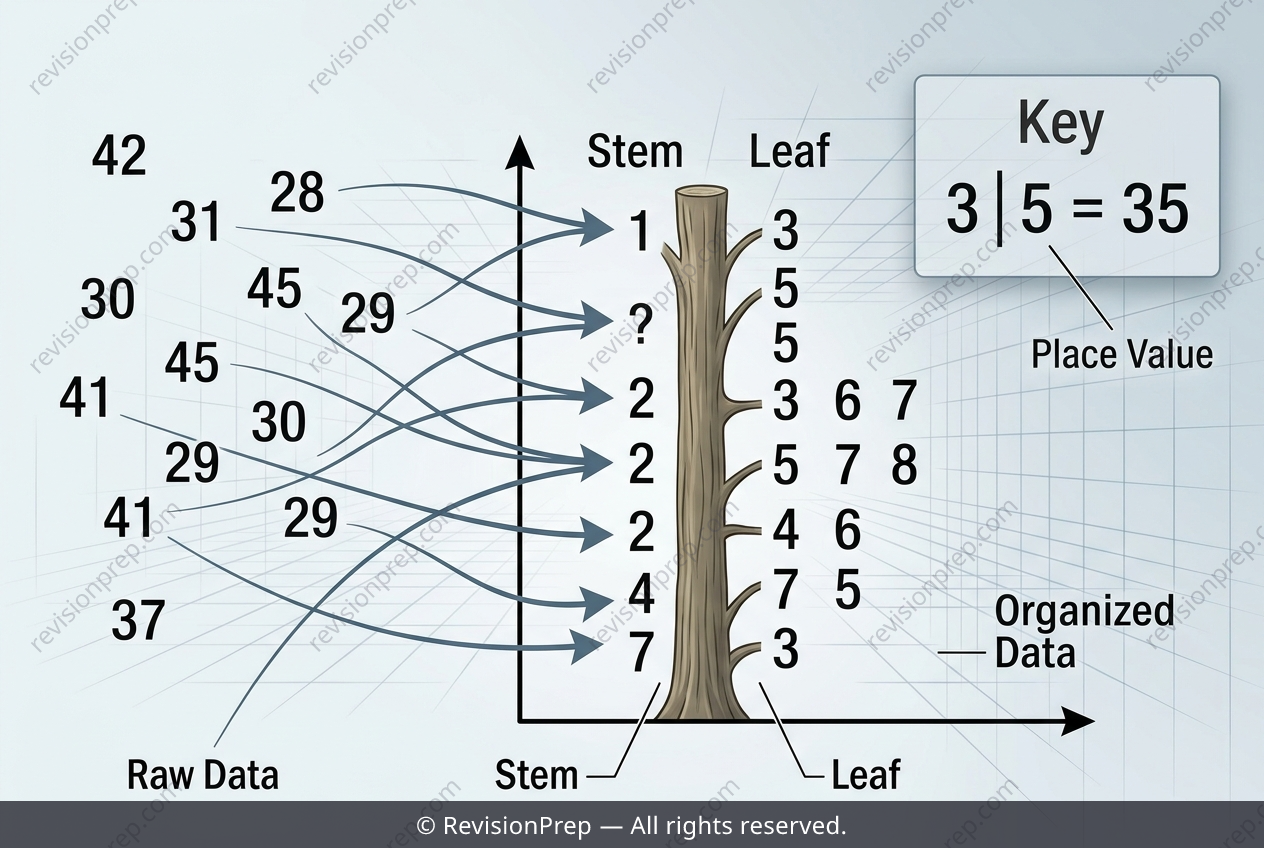
Maths: How Stem-and-Leaf Diagrams Preserve Data
Stem-and-leaf diagrams are a compact way to display numerical data while preserving every original value. Instead of grouping scores into bars, each number is split into a stem (the leading digit or digits) and a leaf (the final digit), so a key like 2 | 6 = 26 tells you to read the stem as the tens digit and the leaf as the ones digit, then combine them into the full score. This structure lets you see the shape of the distribution at a glance—how many scores fall in the twenties, thirties, forties, and so on—while still allowing you to recover each exact data point. The power of this representation lies in the relationship between the rows and the values they contain. A stem of 3 with a leaf of 5 is not just “3 and 5” but the single number 35, formed by placing the leaf directly after the stem. Likewise, any leaf attached to a stem of 4 produces a score in the forties (40–49), while any leaf on a stem of 2 produces a score in the twenties (20–29). This grouping by tens makes it immediate to compare ranges: scores in different stem rows differ by at least ten, even if their leaves are identical. Dot plots offer a similar one-to-one mapping, but stem-and-leaf diagrams add the bonus of retaining the original digits, making them ideal for small datasets where precision matters alongside visual clarity.
Start practising IB questions today
150,000+ IB-styled questions, criteria-mapped and instantly accessible.