
Maths: Why Every Tally Must Match Its Frequency
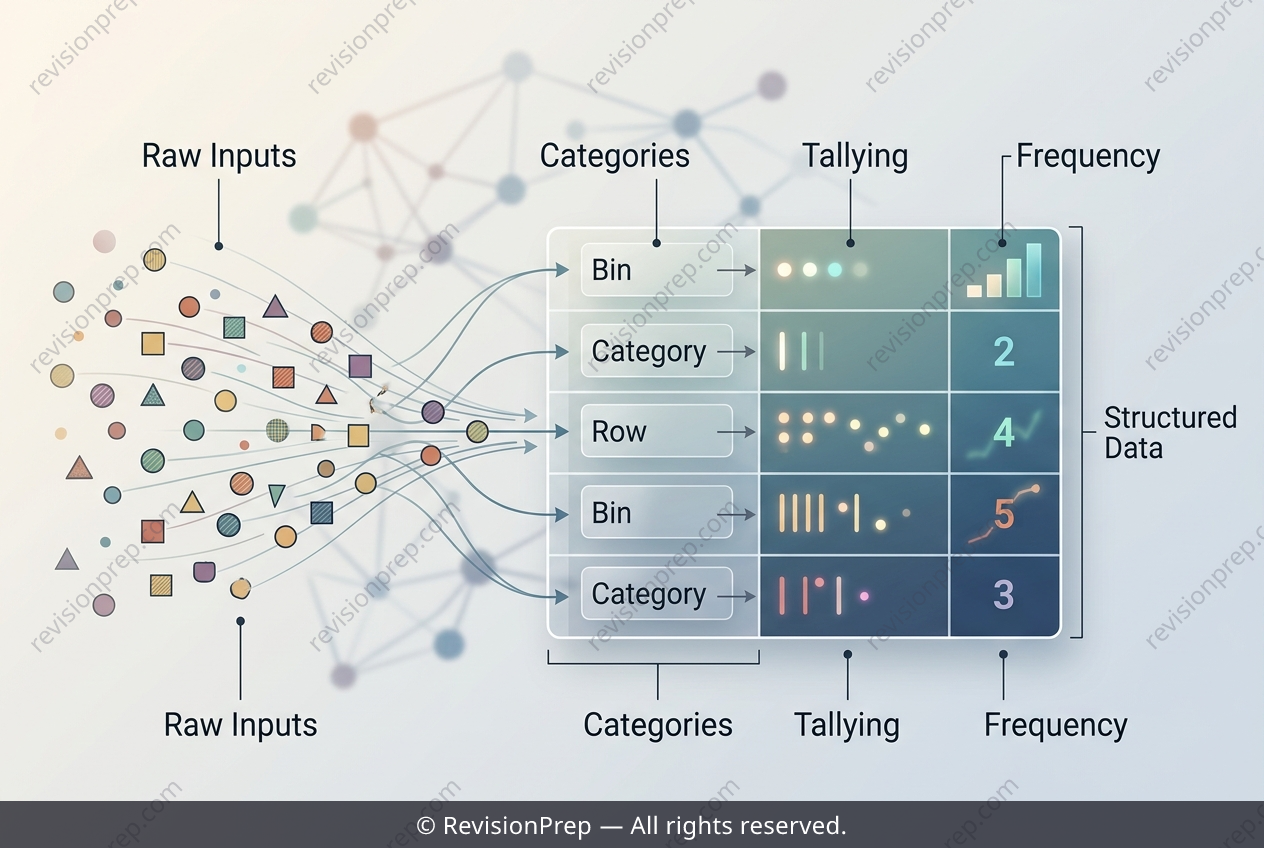
When you collect raw data—like a list of favourite ice cream flavours—it often appears as a jumbled string of words or numbers. The first step in making sense of that chaos is data organization, which turns a messy list into a clear, structured summary. A frequency table is the simplest tool for this job: it sorts categories (the flavours) and counts how often each one appears. Tally marks are the manual counting system behind that table, using groups of five strokes (IIII with a diagonal crossbar for the fifth) to make counting quick and error-free. The core relationship here is that each tally mark represents one observation, and the total tally for a category must equal its frequency—the number of times that value occurs in the dataset. For small datasets, tallying is straightforward, but the method scales to larger sets where visual grouping prevents mistakes. The marking scheme highlights two connected parts: correctly identifying every distinct category (no omissions or inventions) and ensuring each tally count matches its category. If a flavour appears four times, its tally must show four strokes; if another appears once, it shows one. This one-to-one correspondence between raw data, tally marks, and the final frequency number is the essence of frequency distribution—it’s how you transform “Chocolate, Vanilla, Strawberry…” into a clean, readable table that reveals patterns at a glance.
Start practising IB questions today
150,000+ IB-styled questions, criteria-mapped and instantly accessible.