
Physics: How Slope Reveals Speed in Uniform Motion
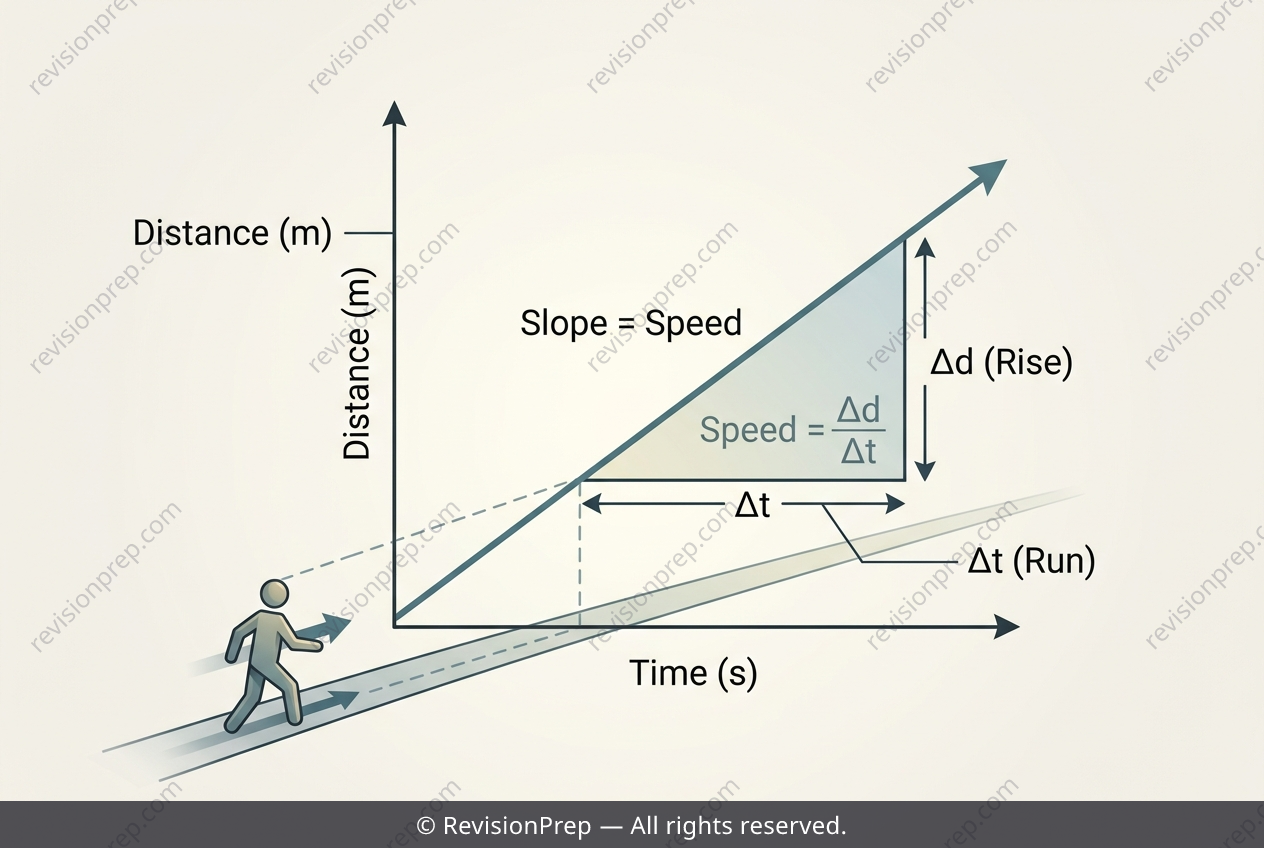
A distance-time graph is one of the simplest yet most powerful tools in kinematics: it tells the story of motion in a single line. At its heart, the graph maps how an object’s position changes over time, and for uniform motion—movement at a constant speed in a straight line—that story appears as a perfectly straight, sloped line. The core idea is that the steepness, or slope, of this line is not just a visual feature; it is the very definition of speed. In other words, speed equals the change in distance divided by the change in time, often written as speed = Δdistance / Δtime. Why does this matter? Because it transforms a static picture into a dynamic measurement. By reading two key points on the graph—the total distance travelled and the total time elapsed—you can unlock the object’s speed without needing a stopwatch or a ruler in the real world. The graph’s slope connects these two quantities: a steeper line means a larger distance covered in the same time, hence a higher speed. For a person walking steadily from the origin to a point at (5 s, 10 m), the slope calculation directly yields the constant speed. Understanding this relationship lets you interpret any straight-line distance-time graph at a glance, turning raw coordinates into meaningful physical insight about how fast something is moving.
Start practising IB questions today
150,000+ IB-styled questions, criteria-mapped and instantly accessible.