
Physics: Reading Efficiency in a Sankey Diagram
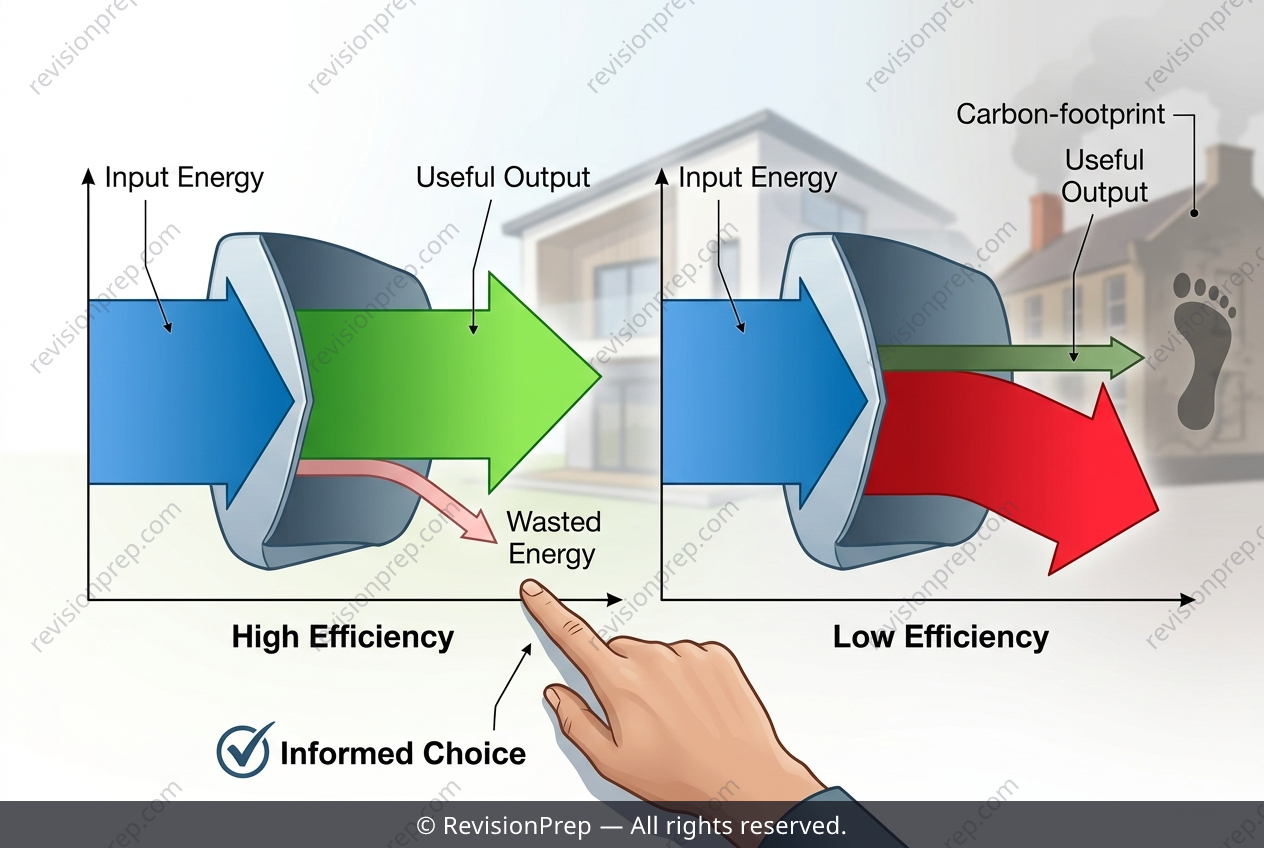
Energy transformations are all around us—every time you switch on a lamp, charge a phone, or boil a kettle, electrical energy is converted into other forms. But not all of that energy ends up where you want it. The core idea here is energy efficiency: the fraction of input energy that is usefully transferred versus the portion that is wasted, usually as heat or sound. Sankey diagrams are the perfect visual tool for this, because they use arrow width to represent the amount of energy flowing through each stage of a transformation. Why does this matter? Because efficiency isn’t just a physics concept—it drives real-world choices about cost, sustainability, and resource use. When you compare two devices, like an LED bulb and an incandescent bulb, the Sankey diagram instantly reveals the split between useful light and wasted thermal energy. The wider the useful arrow, the more efficient the device. By reading these diagrams side by side, you can see which option minimises waste, which saves more energy over time, and which reduces your environmental footprint. In short, Sankey diagrams turn abstract percentages into a clear, visual comparison that supports informed, everyday decisions.
Start practising IB questions today
150,000+ IB-styled questions, criteria-mapped and instantly accessible.