
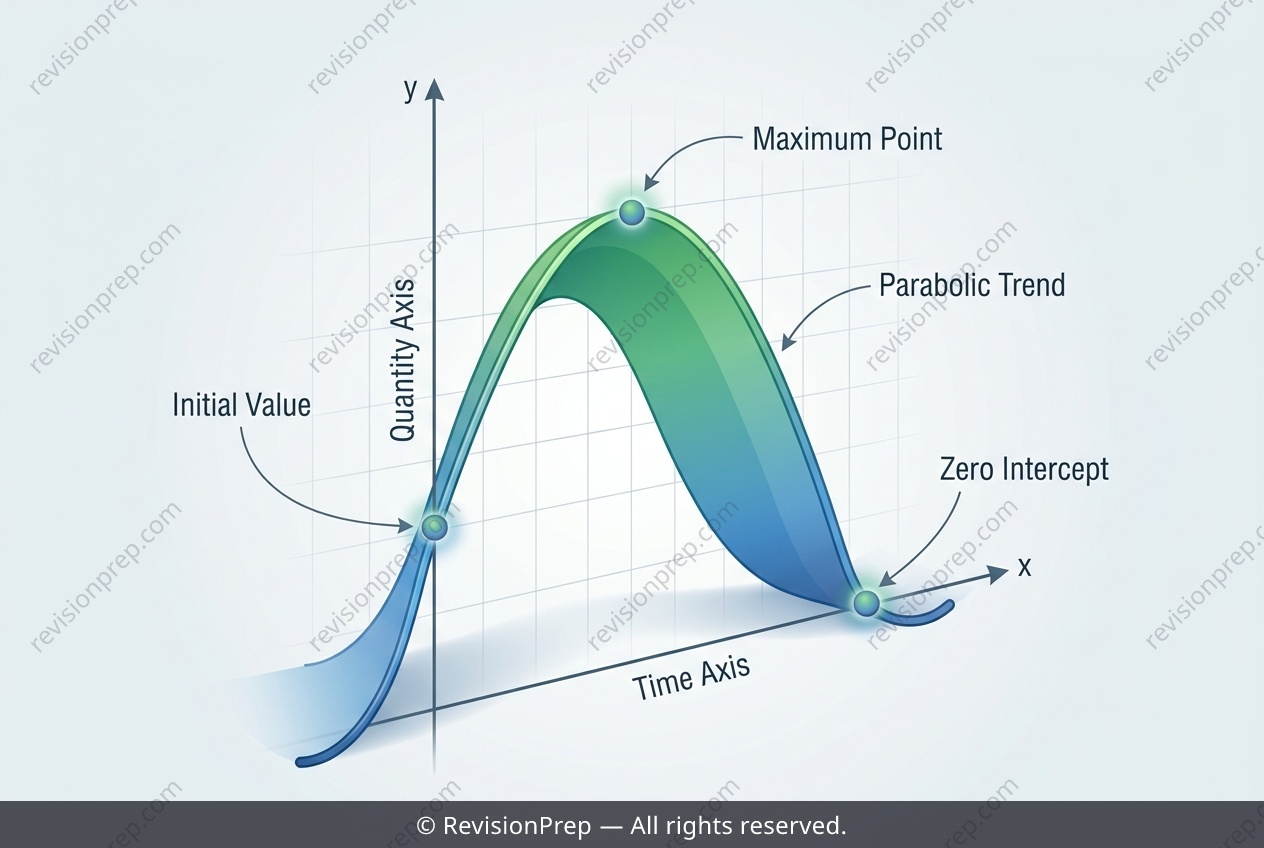
Maths: One Equation, a Population's Rise and Fall
Quadratic functions are more than just curves on a page—they are powerful tools for modelling real-world change, especially when that change involves a rise, a peak, and a fall. In this context, a conservation agency might use a quadratic equation to track a rabbit population over time, where the shape of the parabola reveals not only the maximum population but also when that population will crash to zero. The key lies in the coefficients: the negative leading term tells us the parabola opens downward, guaranteeing a maximum, while the vertex formula t = -b/(2a) pinpoints exactly when that peak occurs. Understanding how these features connect is essential for interpreting the model’s predictions. Once you find the vertex, you can substitute back into the equation to get the peak population. Setting the entire function equal to zero—and solving via the quadratic formula—gives the time when the population disappears entirely. Meanwhile, comparing the function’s value at a specific future date (like setting P(t) = 100) reveals whether a threshold is crossed before a critical deadline. Because the parabola is symmetric around its vertex, the decline after the peak mirrors the growth before it, allowing you to reason about intervals of concern without plotting every point. This single equation thus weaves together maximums, roots, and inequalities into one coherent story about sustainability and intervention.
Start practising IB questions today
150,000+ IB-styled questions, criteria-mapped and instantly accessible.