
Maths: Predicting a Parabola Without Plotting It
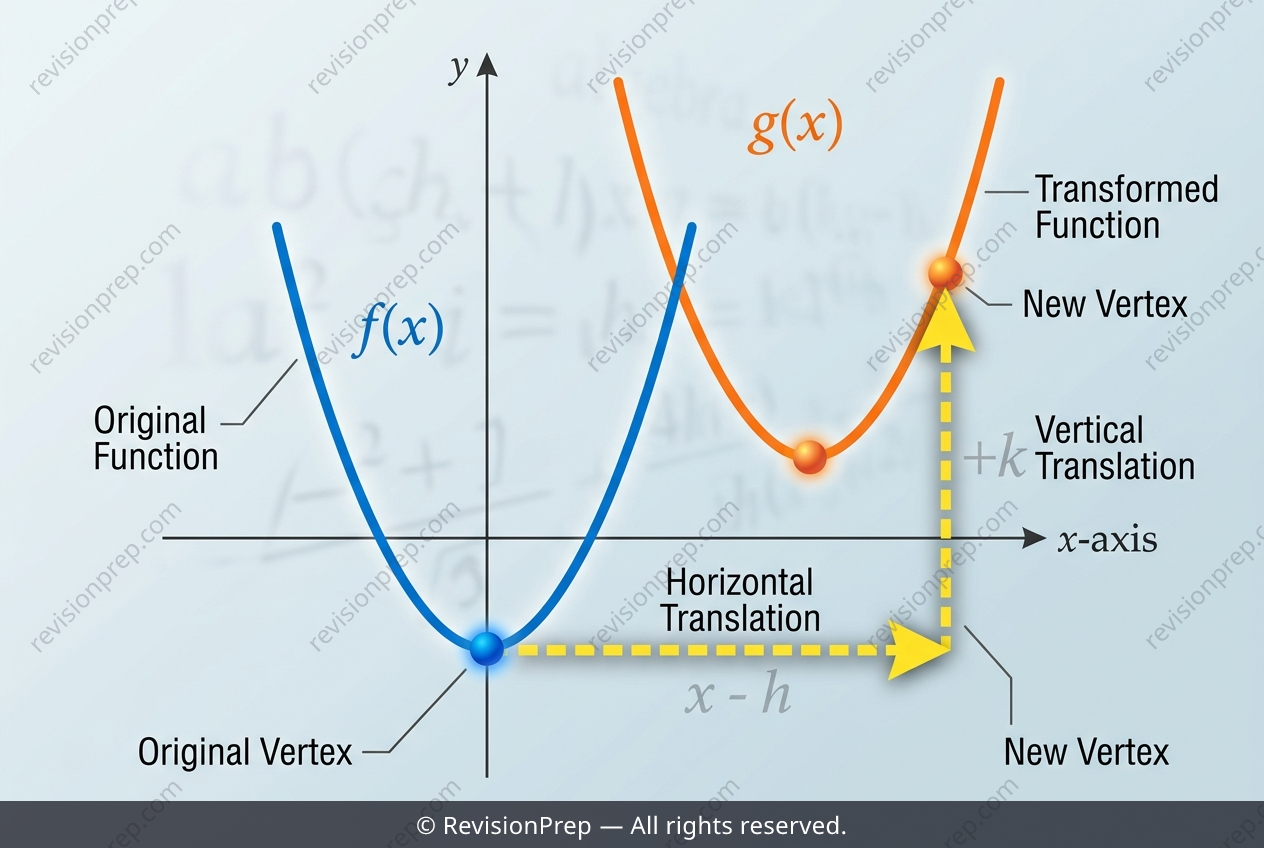
Transformations of quadratic functions are a cornerstone of understanding how graphs behave under shifts and stretches. At its heart, this topic asks you to see a function not just as an equation, but as a shape that can be moved predictably on the coordinate plane. When you apply a horizontal shift and a vertical translation to a parabola, every key feature—the vertex, the axis of symmetry, and the intercepts—moves or changes in a coordinated way. The relationship between the original function f(x) and its transformed image g(x) = f(x − 3) + 7 is built on two simple rules: subtracting a constant inside the brackets shifts the graph right, while adding a constant outside shifts it up. To find the new equation, you substitute (x − 3) for every x in the original expression, then simplify into the standard quadratic form ax² + bx + c. This form becomes essential when checking for x-intercepts, because the discriminant, Δ = b² − 4ac, tells you whether the parabola crosses the x-axis at all. If Δ is negative, the graph stays entirely above or below the axis, meaning no real roots exist. Understanding how these pieces connect—the vertex formula, the substitution method, and the discriminant—lets you fully describe the transformed graph without ever plotting it.
Start practising IB questions today
150,000+ IB-styled questions, criteria-mapped and instantly accessible.