
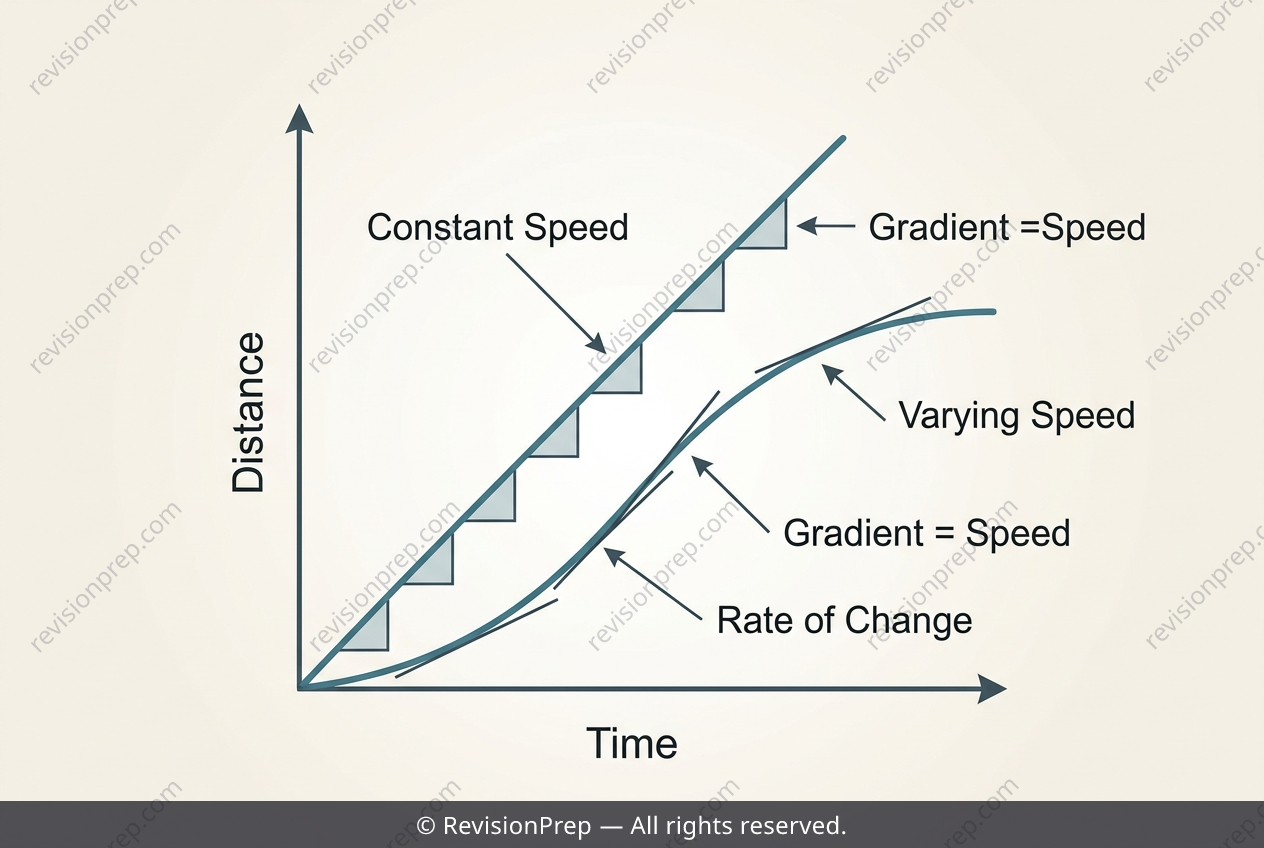
Maths: Straight Line vs Curve — Reading Speed
Distance–time graphs are the visual language of motion, turning a cyclist’s journey into a story told by gradients. At its heart, this topic asks you to read speed as the rate of change of distance over time—the slope of the graph at any instant. When that slope stays constant, the graph is a straight line, revealing uniform speed. When the slope shifts, the line bends into a curve, signalling acceleration or deceleration. Why does this matter? Because real journeys are rarely smooth. A hilly route forces a rider to slow on climbs and speed up on descents, while a flat road allows a steady pace. By plotting both on the same axes, you compare not just distances but the pattern of effort. The straight line for the flat-road cyclist emerges from distance = speed × time, where speed is fixed. The curve for the hilly rider appears because her hourly speed changes—calculated as the difference in distance between consecutive hours—so the gradient rises and falls. This connection between slope, speed, and time is the key: it lets you judge claims like “maintaining a minimum speed” by inspecting each segment’s steepness, not just the overall average.
Start practising IB questions today
150,000+ IB-styled questions, criteria-mapped and instantly accessible.