
Maths: Testing an Exponential Growth Model
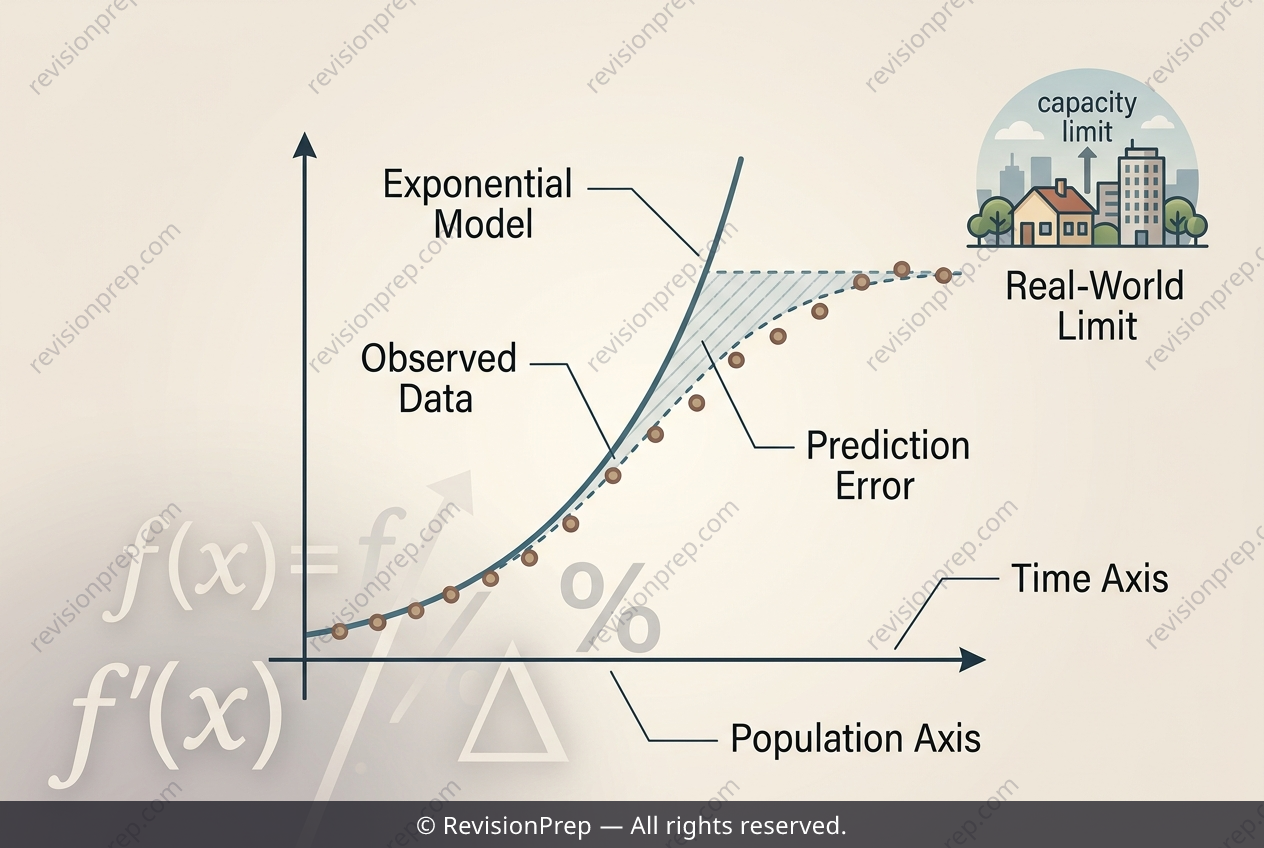
Exponential growth models are powerful tools for predicting how quantities—like populations, investments, or viral spread—change over time. At their core, they assume a constant percentage increase per unit time, which is why they produce the characteristic J-shaped curve. In this post, we explore a practical application: validating a town’s population model against real census data, and critically, examining where the model begins to fail. The model P(t) = 5000 × 10^(0.02t) predicts population based on time, but the real insight comes from comparing its output to observed values. By calculating percentage error—the absolute difference between predicted and observed, divided by the observed value, times 100%—we quantify how far the model drifts. The key relationship here is that as t increases, the exponential term grows faster than the observed data, causing errors to widen. This reveals a fundamental limitation: exponential models assume unlimited resources and constant growth rates, which rarely hold in reality. Understanding this validation process—checking predictions, measuring error, and interpreting trends—is essential for deciding when a model is trustworthy and when it should be abandoned.
Start practising IB questions today
150,000+ IB-styled questions, criteria-mapped and instantly accessible.