
Physics: Systematic Error and Relative Uncertainty in Kinematics
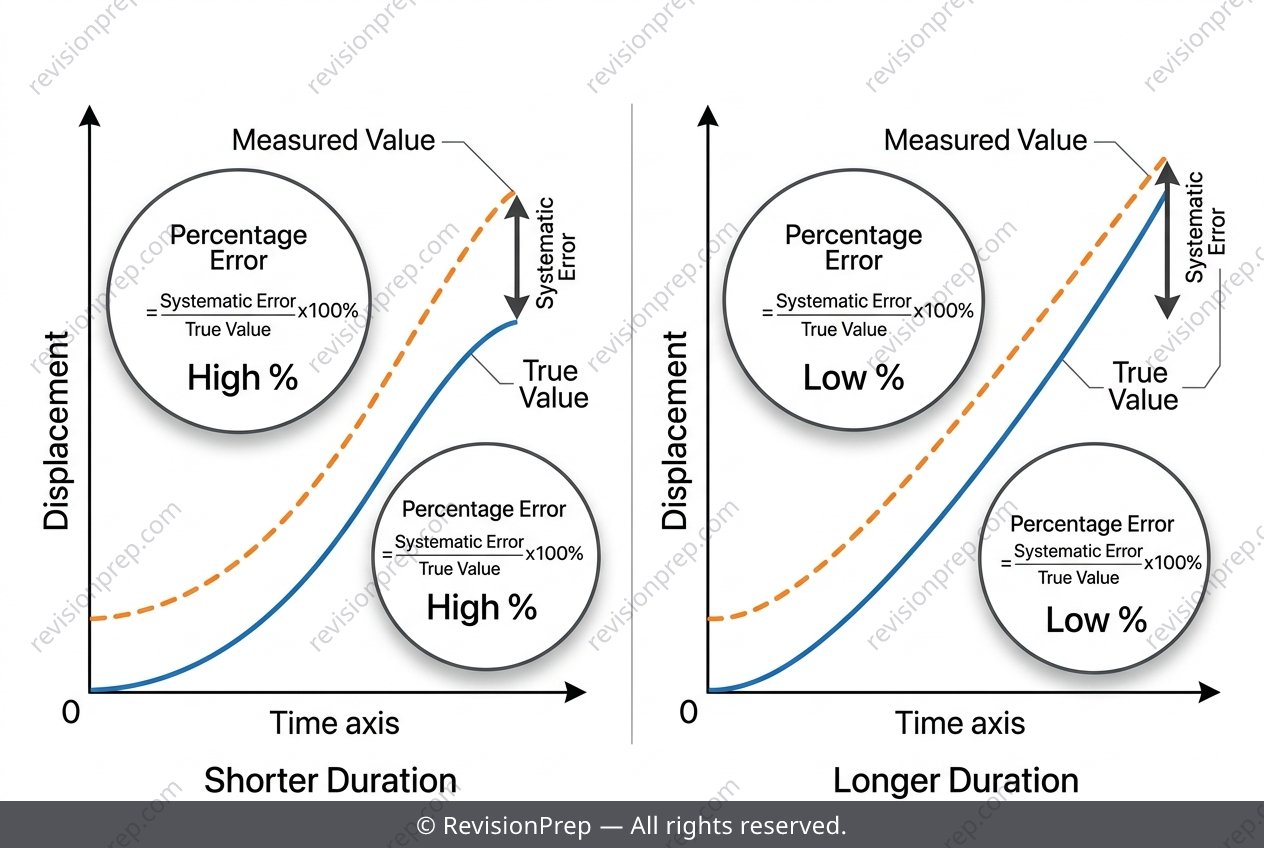
Kinematics is the study of motion—how position, velocity, and acceleration change over time—and the velocity-time graph is its most powerful visual tool. For an underwater ROV moving along a pipeline, the graph splits into three distinct phases: constant acceleration from rest, steady cruising, and constant deceleration back to rest. Each phase has a simple geometric interpretation: the area under the graph gives displacement, while the slope gives acceleration. In this journey, the acceleration is found from the change in velocity divided by the time interval (a = Δv/Δt), and the total displacement is the sum of the areas of a triangle, a rectangle, and another triangle. But real measurements are never perfect. Here, the position sensor has a systematic error of +2.5 m—it always reads slightly too high. This fixed offset shifts the measured displacement and average velocity (v = s/t) upward, but crucially, its impact depends on the journey length. When the true displacement doubles, the same absolute error is spread over more distance, so the relative error (percentage error = absolute error / true value × 100) shrinks. This reveals a core idea: systematic errors affect accuracy, not precision, and their relative significance decreases as the measured quantity grows—a relationship that connects the graph’s geometry to the reliability of your final result.
Start practising IB questions today
150,000+ IB-styled questions, criteria-mapped and instantly accessible.