
IB Economics Macroeconomics
The unit that decides your Paper 1, dominates Paper 2, and drives every HL Paper 3 calculation.
Quick facts
IB Economics Macroeconomics is the unit examiners return to again and again — it supplies a Paper 1 essay option almost every session, dominates the SL/HL common Paper 2 data-response questions, and generates nearly every HL Paper 3 calculation. Most exam scenarios follow one recurring pattern: a central bank raising rates to fight inflation while growth slows, whether it's the RBI, the Chilean central bank, or a fictional 'Country X'. This teaser walks through the five ideas that unlock most of that content: how monetary policy actually transmits through the economy, how the reserve requirement ratio and money multiplier work for HL calculations, how real GDP differs from nominal GDP, how the output gap frames the business cycle, and how income and wealth inequality get measured and compared. The full revision notes on RevisionPrep go deeper into every diagram, definition, and worked calculation you'll need.
What you’ll be able to do
Monetary Policy: How a Rate Change Ripples Through the Economy
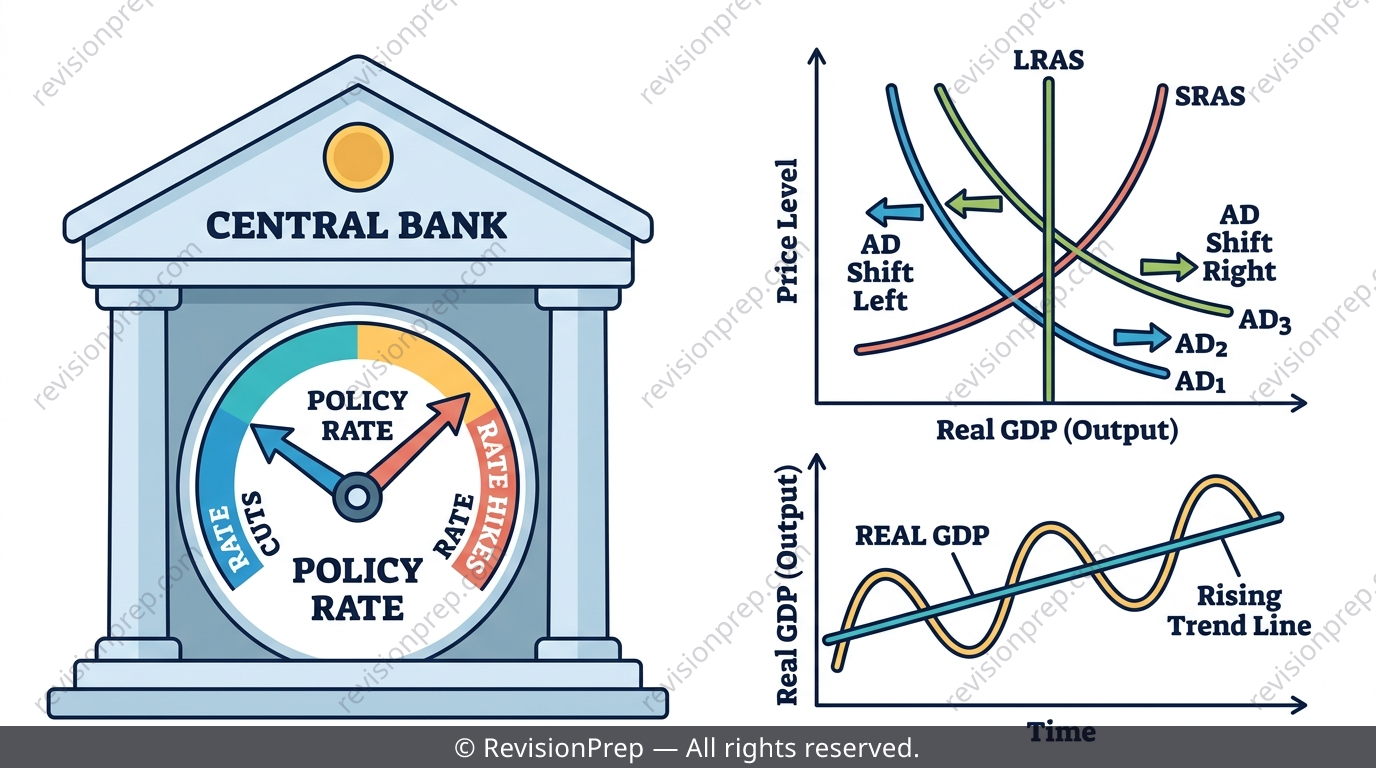
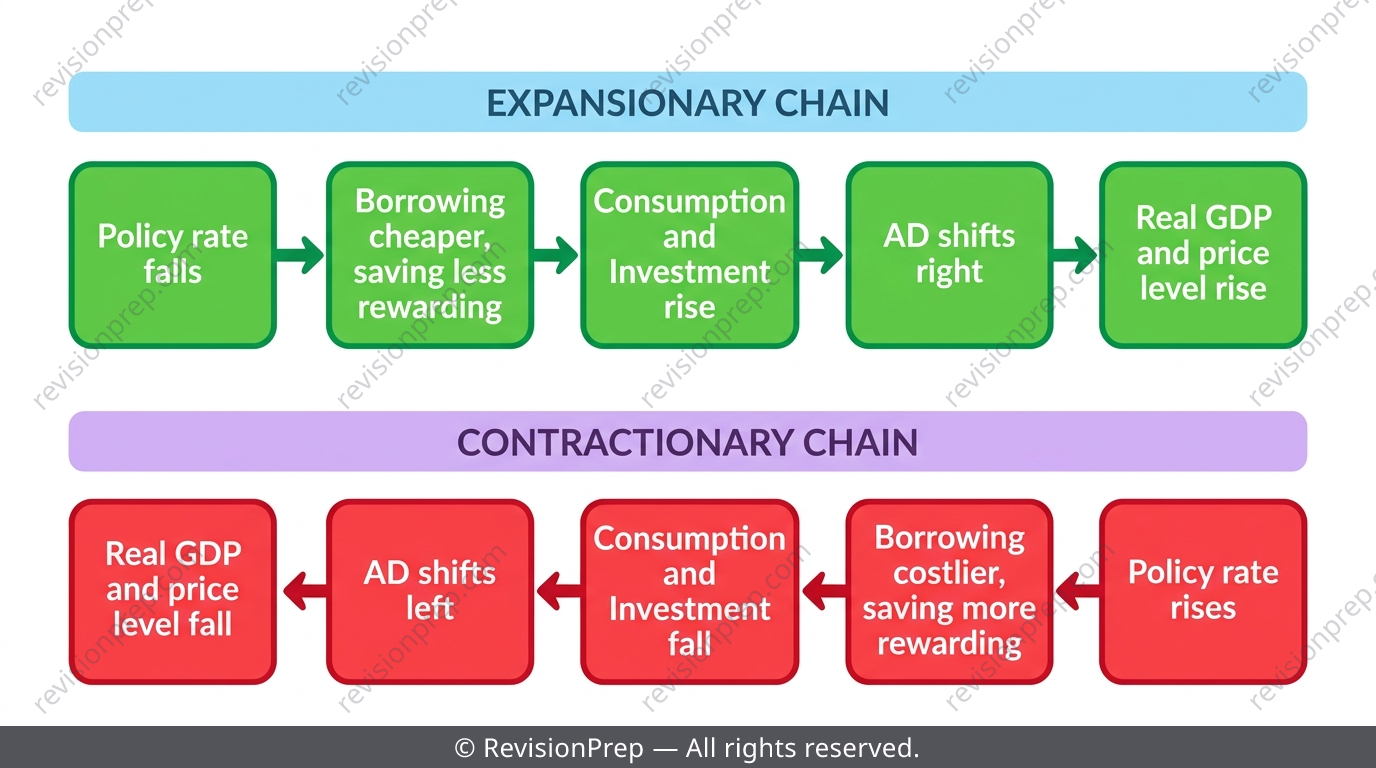
The central bank's policy rate is the benchmark from which every mortgage, savings, and business loan rate moves, with a lag. Cut the rate and borrowing gets cheaper while saving gets less rewarding, so consumption and investment rise, shifting AD right and pushing up both real GDP and the price level. Raise the rate — the scenario tested most often in recent papers — and the opposite happens: AD shifts left, inflation eases, but growth slows as a side-effect. When the policy rate is already near zero, central banks switch to quantitative easing, buying government bonds to inject reserves directly into the banking system.
Exam tip
For 'explain' questions on exchange rates, state the capital flow AND the currency movement explicitly — a correct mechanism with no stated conclusion still loses the final mark.
Common mistake
Explaining the interest rate differential's effect on capital flows correctly but never concluding which currency appreciates or depreciates.
Mini summary
Policy rate ↓ → C and I rise → AD right → GDP and prices up. Policy rate ↑ → the reverse. QE kicks in at the zero lower bound.
Reserve Requirement Ratio, Excess Reserves & the Money Multiplier
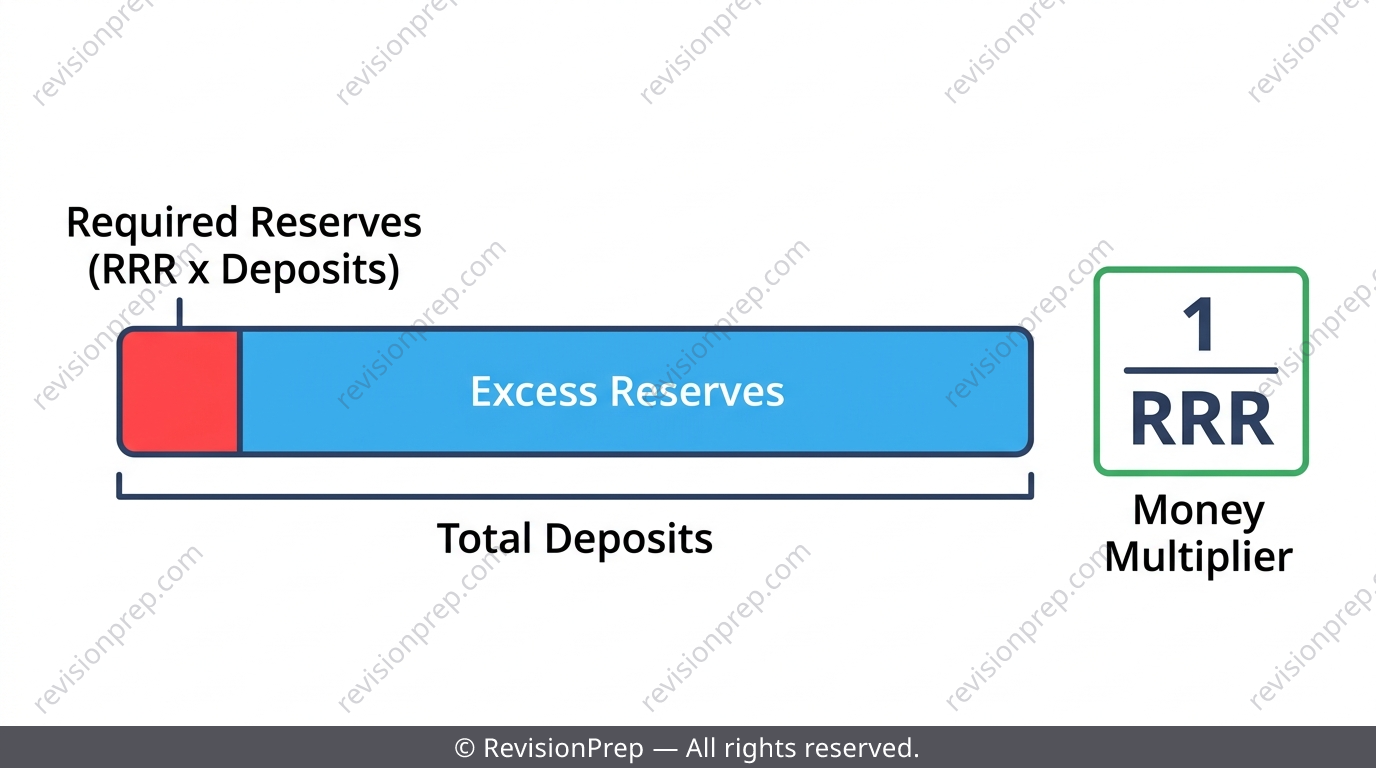
The reserve requirement ratio (RRR) is the minimum fraction of deposits a commercial bank must hold rather than lend out — a second, less-used lever separate from the interest rate. A LOW RRR means banks can lend out MORE of every deposit, so it increases credit creation, not decreases it. Required reserves are found by multiplying the RRR by total deposits, never by the reserves already held, and excess reserves are simply actual reserves minus that required amount. The money multiplier, , shows the theoretical maximum expansion of the money supply per unit of new reserves — this is the calculation HL students meet most often on Paper 3.
Exam tip
Always apply the RRR to total deposits, never to reserves already held — this is the single most common trap in reserve calculations.
Common mistake
Writing 'excess reserves = actual reserves × RRR' instead of subtracting (RRR × total deposits) from actual reserves.
Mini summary
Required reserves = RRR × total deposits. Excess reserves = actual − required. Money multiplier = 1/RRR — a lower RRR means more credit creation.
GDP, GNI, and Why Real GDP Is the Only Growth Figure That Matters
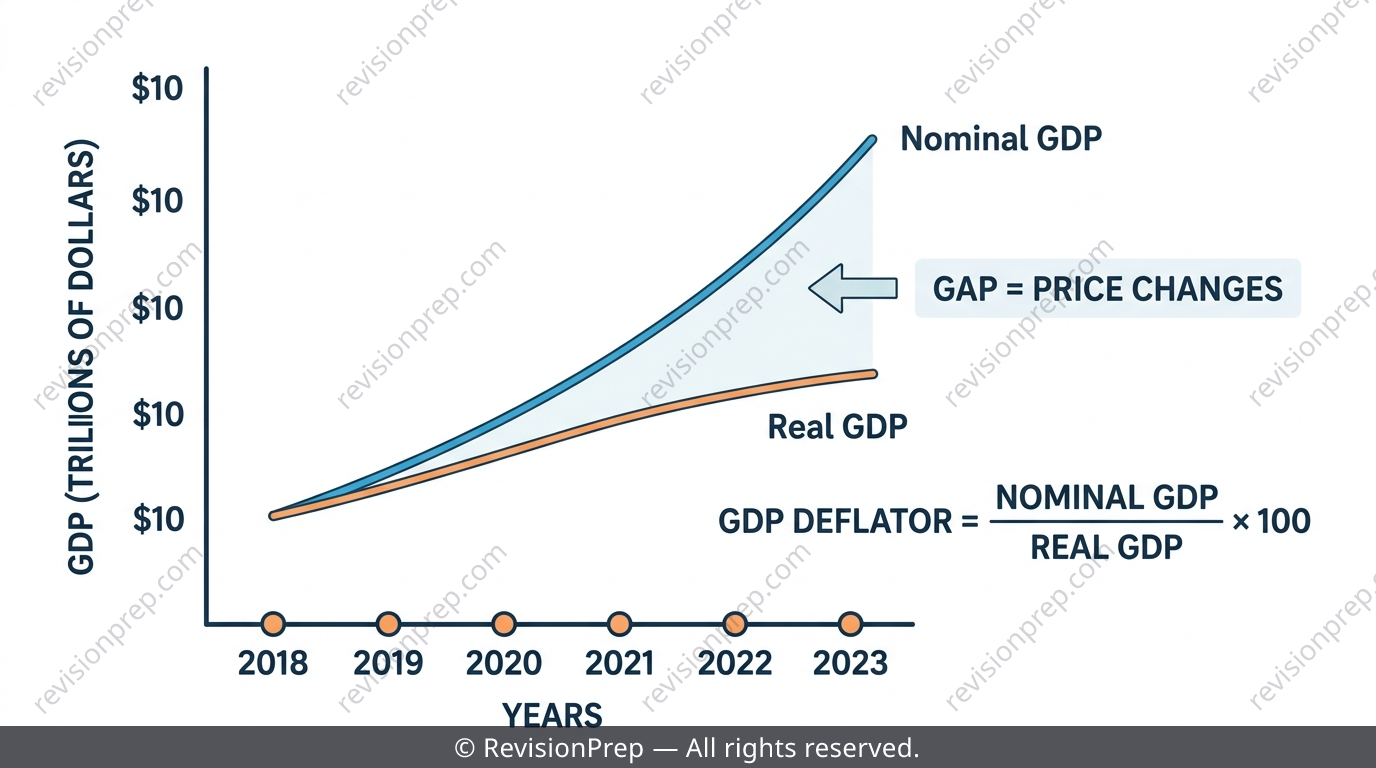
GDP measures the output, income, or expenditure generated within a country's borders, while GNI adjusts for net income earned by nationals abroad — the better measure of what residents actually earn. Nominal GDP rises even with zero extra output whenever prices rise, so the GDP deflator is used to strip out that price effect and produce real GDP, the only figure worth quoting when comparing growth across years. Mixing up nominal and real growth is the single most common error in data-response answers.
Exam tip
Never comment on 'economic growth' using a nominal GDP figure — deflate first, or you risk mistaking inflation for genuine output growth.
Common mistake
Quoting the nominal GDP growth rate directly as 'economic growth' without checking whether the deflator has changed.
Mini summary
GDP = output within borders. GNI adjusts for income to/from abroad. Real GDP = Nominal GDP ÷ GDP deflator × 100 — always use real figures for growth.
The Business Cycle and the Output Gap
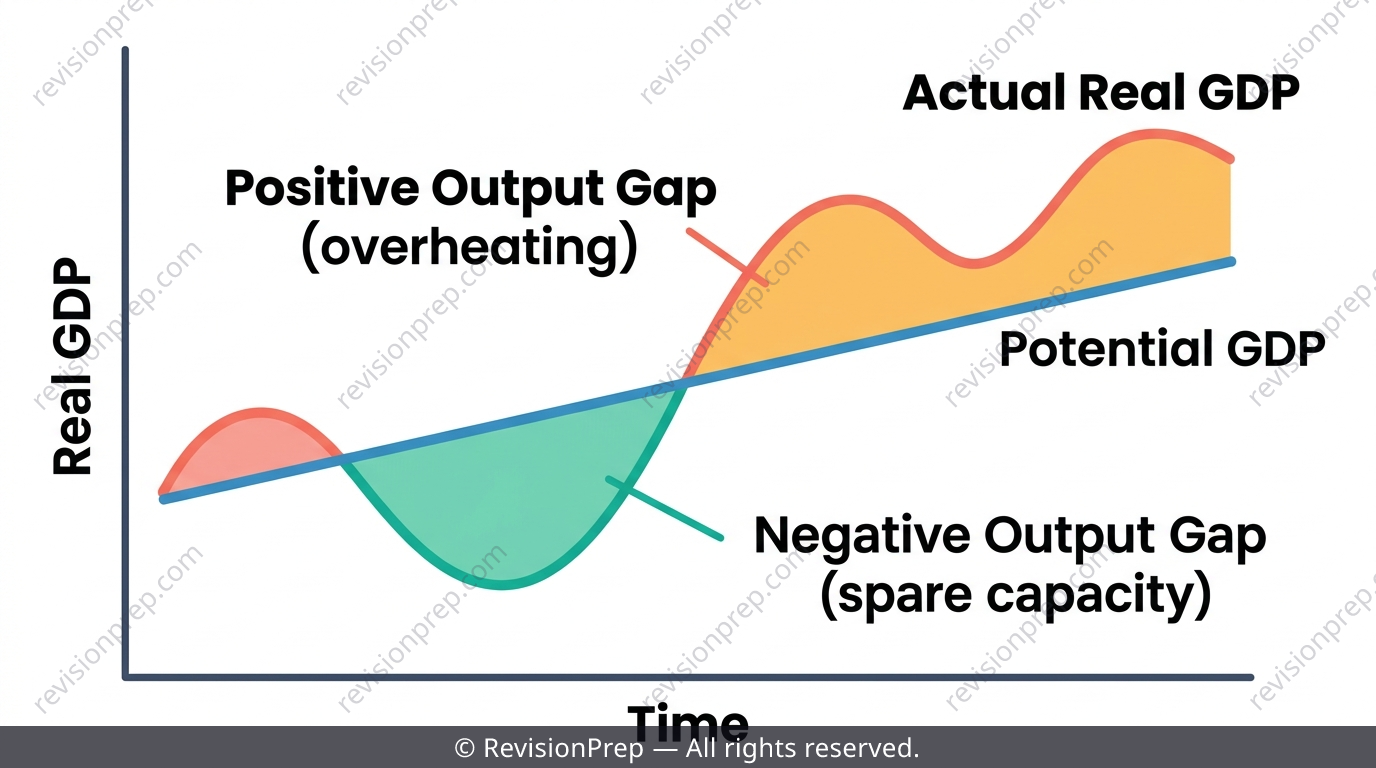
Real GDP oscillates around a rising long-run trend in a repeating pattern of expansion, peak, contraction (recession — commonly two consecutive quarters of negative growth), trough, and recovery. The output gap measures the difference between actual and potential GDP: a positive gap means the economy is overheating with inflation risk, while a negative gap signals spare capacity and higher unemployment. A recession means the growth rate turns negative, not that the level of GDP collapses to zero.
Exam tip
The positive/negative output gap vocabulary reappears across AD/AS and Phillips curve analysis, so lock it in early.
Common mistake
Drawing the actual GDP curve dipping to zero or below the x-axis during a 'recession' — the curve should stay well above zero, just falling in growth rate.
Mini summary
Business cycle: expansion → peak → contraction → trough → recovery. Positive output gap = overheating; negative output gap = spare capacity.
Income vs Wealth Inequality and Absolute vs Relative Poverty
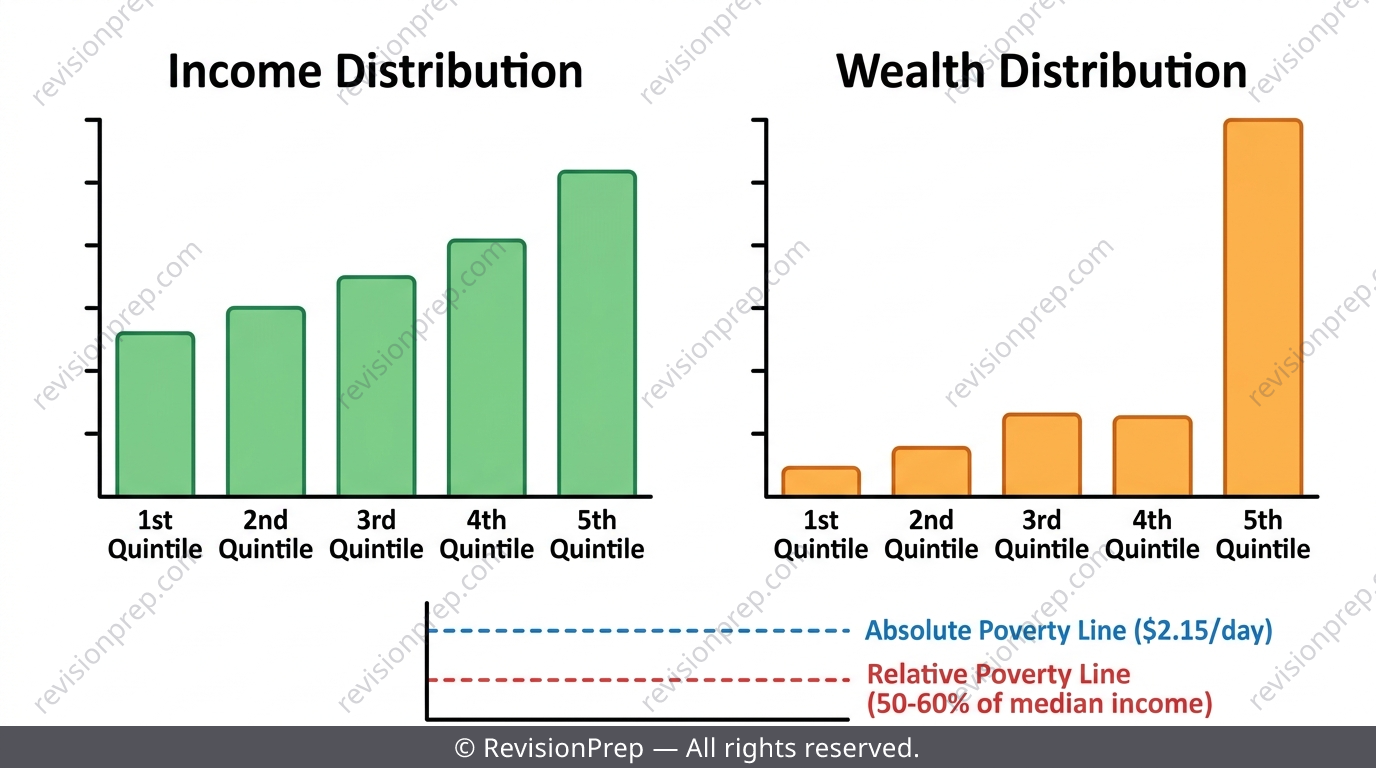
Income inequality describes the uneven distribution of income, a flow, while wealth inequality concerns accumulated assets like property, shares, and savings, a stock — and wealth is almost always more unevenly distributed than income. Absolute poverty is a fixed threshold, such as the World Bank's $2.15/day PPP line, and can in principle be eliminated entirely. Relative poverty is defined against the median income of a society, typically below 50-60% of it, meaning it can persist or even rise even as everyone's living standards improve. Causes range from unequal ownership of factors of production and education gaps to globalisation pressures and regressive tax systems.
Exam tip
When a question asks you to 'compare' inequality measures, always specify whether you mean income (flow) or wealth (stock) — mixing them up is an easy mark to lose.
Common mistake
Treating absolute and relative poverty as interchangeable, when relative poverty can rise even while absolute poverty falls.
Mini summary
Income inequality = flow; wealth inequality = stock (usually worse). Absolute poverty = fixed threshold; relative poverty = tied to median income.
Quick formula sheet
Practice questions
- Define GDP and explain how it differs from GNI.
- What is the difference between absolute poverty and relative poverty?
- State the formula for the money multiplier and explain what it measures.
- Explain the transmission mechanism through which a central bank interest rate cut affects real GDP and the price level.
- A country's nominal GDP rises from $500bn (deflator = 100) to $550bn (deflator = 110). Calculate the real GDP growth rate.
- Explain why a rise in the reserve requirement ratio reduces credit creation in the banking system.
- Evaluate the effectiveness of quantitative easing as a policy tool at the zero lower bound compared to conventional interest rate policy.
- A central bank raises its policy rate while another country's central bank cuts its rate. Explain the likely impact on the exchange rate between the two currencies using capital flow analysis.
- To what extent can progressive taxation address wealth inequality, given that wealth inequality is typically more severe than income inequality?
Frequently asked questions
What's the difference between monetary and fiscal policy in IB Economics?+
Monetary policy is set by the central bank using the policy rate (and tools like RRR and QE) to influence AD through borrowing and saving behaviour, while fiscal policy uses government spending and taxation. IB questions frequently compare which tool suits a given scenario better.
Do SL students need to learn quantitative easing?+
QE and the reserve requirement ratio calculations sit in the core monetary policy content shared by SL and HL, but the quantitative multiplier and reserve arithmetic on Paper 3 is HL-only.
What's the difference between real and nominal GDP?+
Nominal GDP is measured in current prices and can rise purely because prices rose, while real GDP strips out that price effect using the GDP deflator — always use real GDP when discussing growth.
How do you calculate excess reserves for IB Economics Paper 3?+
Excess reserves equal actual reserves minus required reserves, where required reserves are the RRR multiplied by total deposits — never apply the RRR to the reserves already held.
What's the difference between absolute and relative poverty?+
Absolute poverty is measured against a fixed threshold like the World Bank's $2.15/day line and can theoretically be eliminated, while relative poverty is defined against a society's median income and can persist or rise even as living standards improve overall.
Why does a lower reserve requirement ratio increase credit creation rather than decrease it?+
A lower RRR means banks must hold back a smaller fraction of each deposit, so they can lend out a larger fraction — more lending means more credit creation, not less.
Get the full IB DP Economics Macroeconomics notes
Related articles