
Ecology and Environment
How living things, energy, and the environment connect — the MYP 1 core ecology concepts, decoded.
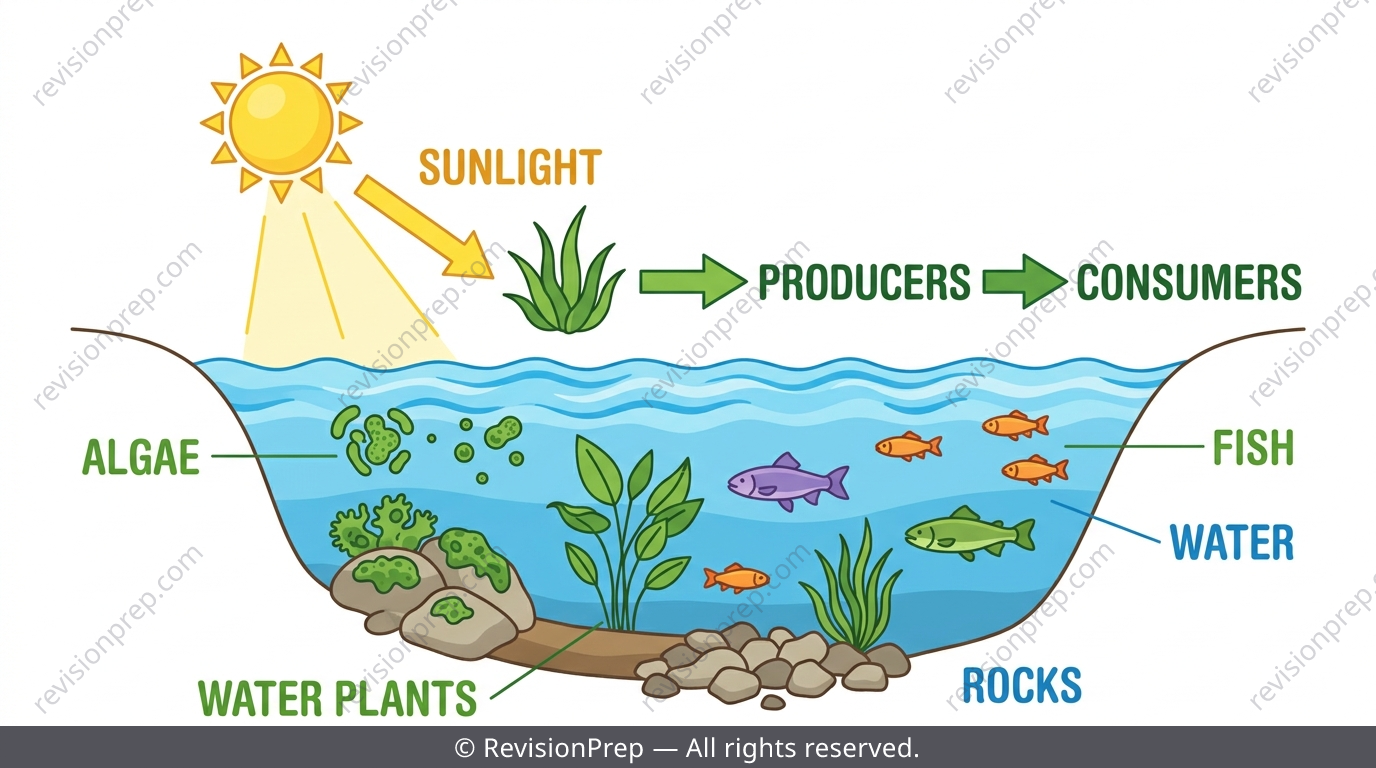
Quick facts
Ecology and Environment is one of the most visual, data-driven units in IB MYP 1 Sciences — and one of the easiest to lose marks on if you rush the vocabulary. Every exam question tends to hand you a real-looking ecosystem — a pond, a forest list, a quadrat table — and ask you to classify it, describe it, or spot a pattern in the numbers. This means success depends less on memorising and more on applying core ideas: what counts as biotic versus abiotic, how energy shrinks as it climbs trophic levels, why ecological pyramids take the shapes they do, and how human activity like deforestation and pollution disrupts the whole system. This teaser walks through the five ideas that show up again and again in MYP Sciences assessments, with the exact traps students fall into and how to avoid them. The full revision notes go deeper with worked examples and complete definitions.
What you’ll be able to do
Ecosystems, Populations, Communities and Biomes
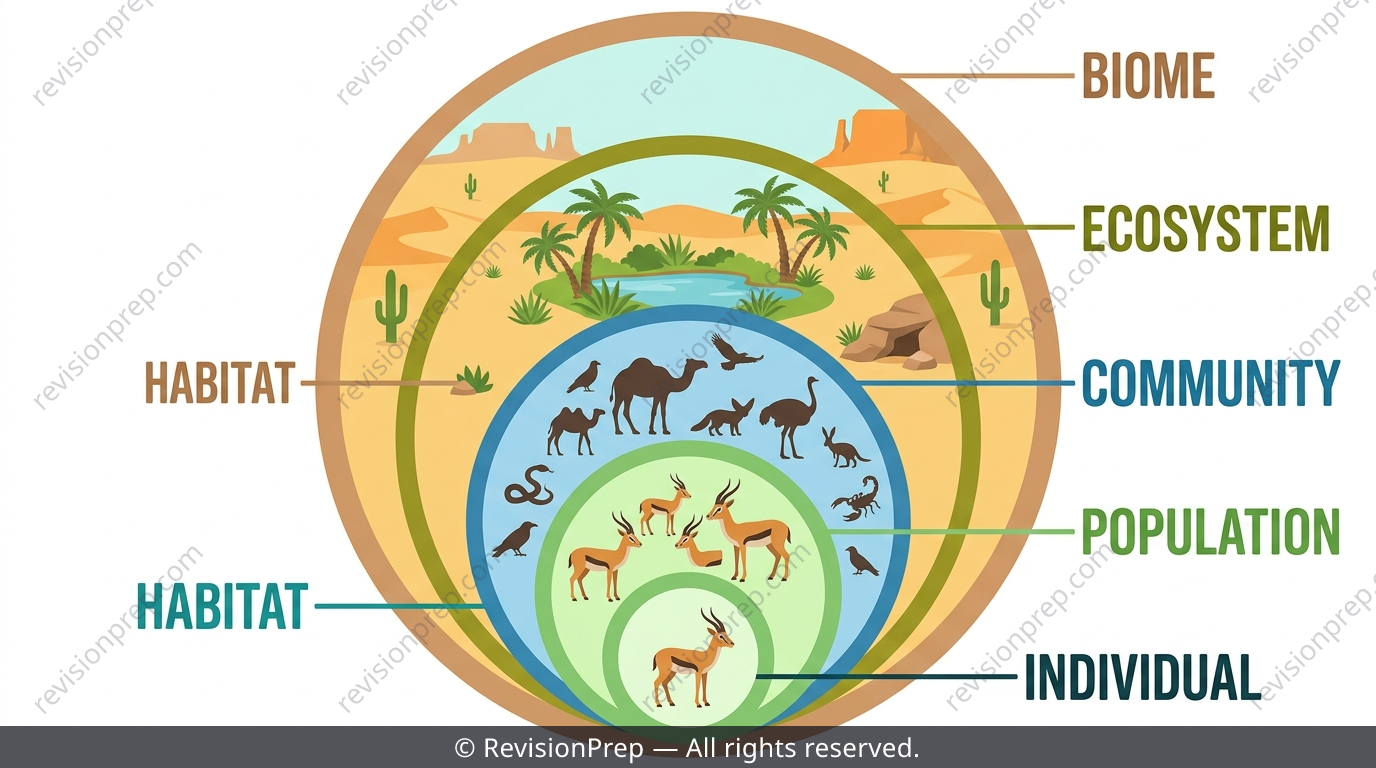
An ecosystem is everything in an area — living and non-living — plus how they interact. Zoom in and a population is all the individuals of ONE species in an area, while a community is all the different populations living together. Zoom out and a biome is a huge region defined by climate and vegetation, like desert or tropical rainforest, containing many ecosystems inside it. A habitat, meanwhile, is just the specific address an organism lives at within its ecosystem.
Exam tip
Remember the order from biggest to smallest: biome > ecosystem > community > population > individual. Habitat is the specific spot, not a size category.
Biotic vs Abiotic Components
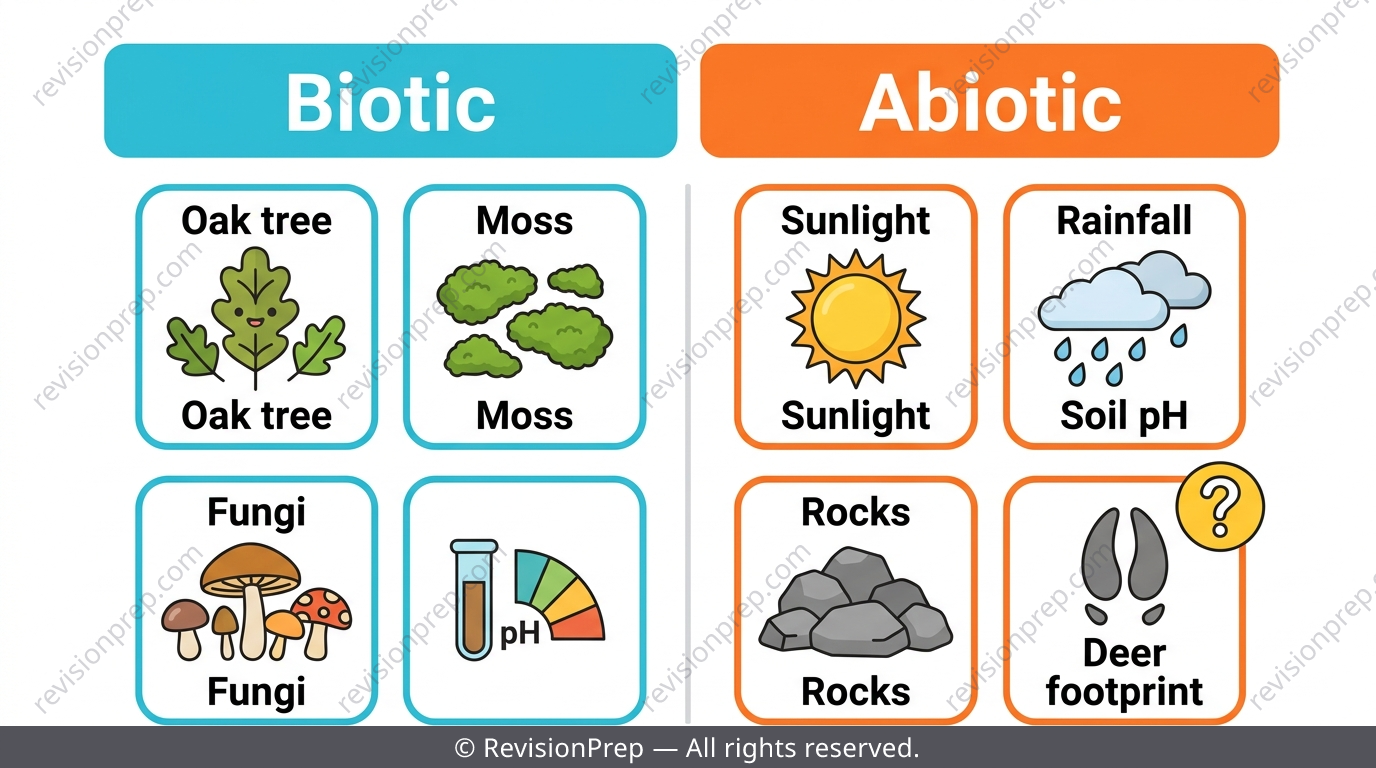
Biotic components are anything that is or was alive — plants, animals, fungi, bacteria, even dead leaves. Abiotic components are everything non-living that still affects the ecosystem, like water, sunlight, temperature, and soil pH. The strict test is: 'Is this thing itself alive or made of living material?' — not whether life depends on it, which is why sunlight and water are never biotic even though they're essential for survival.
Common mistake
Students often classify water, sunlight, or oxygen as biotic because living things depend on them. Also watch for 'disguised' abiotic items like deer tracks or footprints — the physical trace itself is abiotic, even though it's connected to an animal.
Mini summary
Test biotic vs abiotic by asking: does this thing itself breathe, grow, or reproduce?
Energy Flow Through Trophic Levels
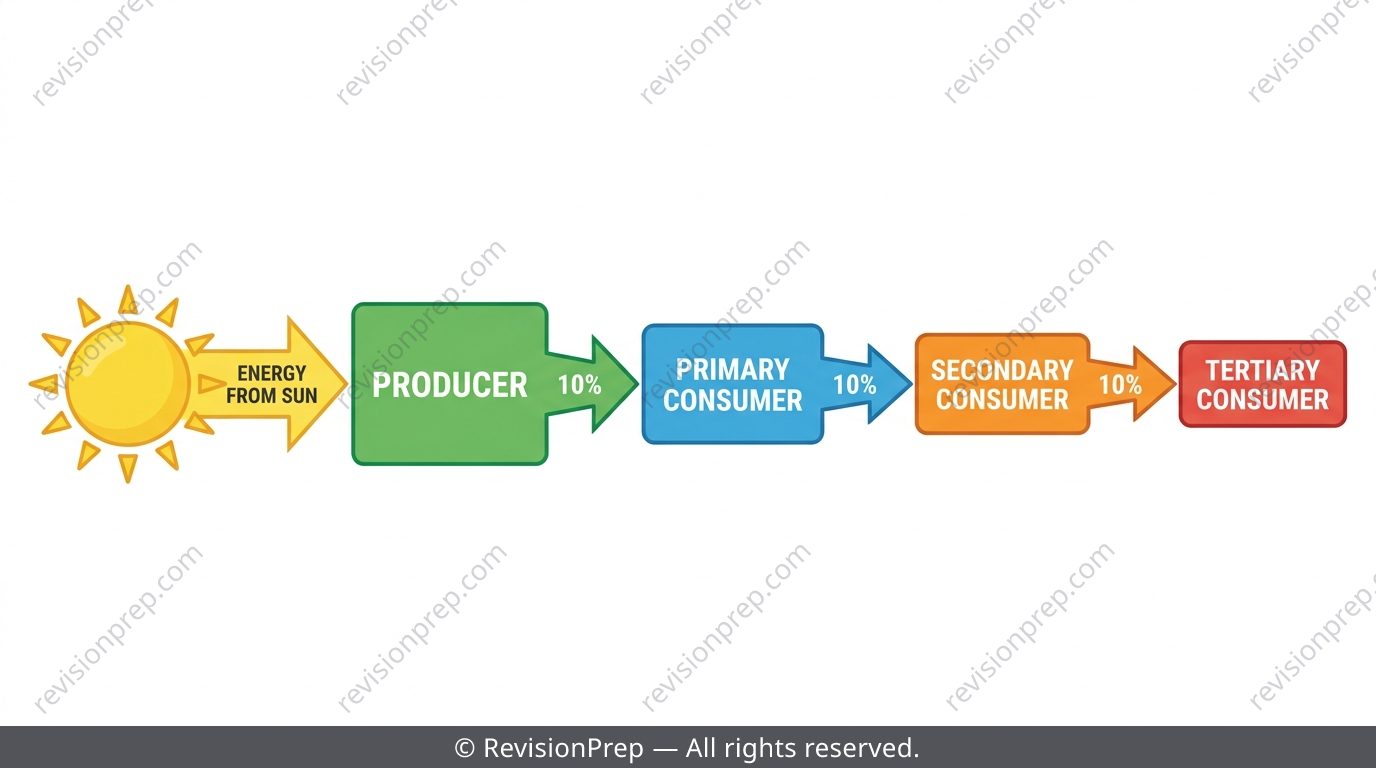
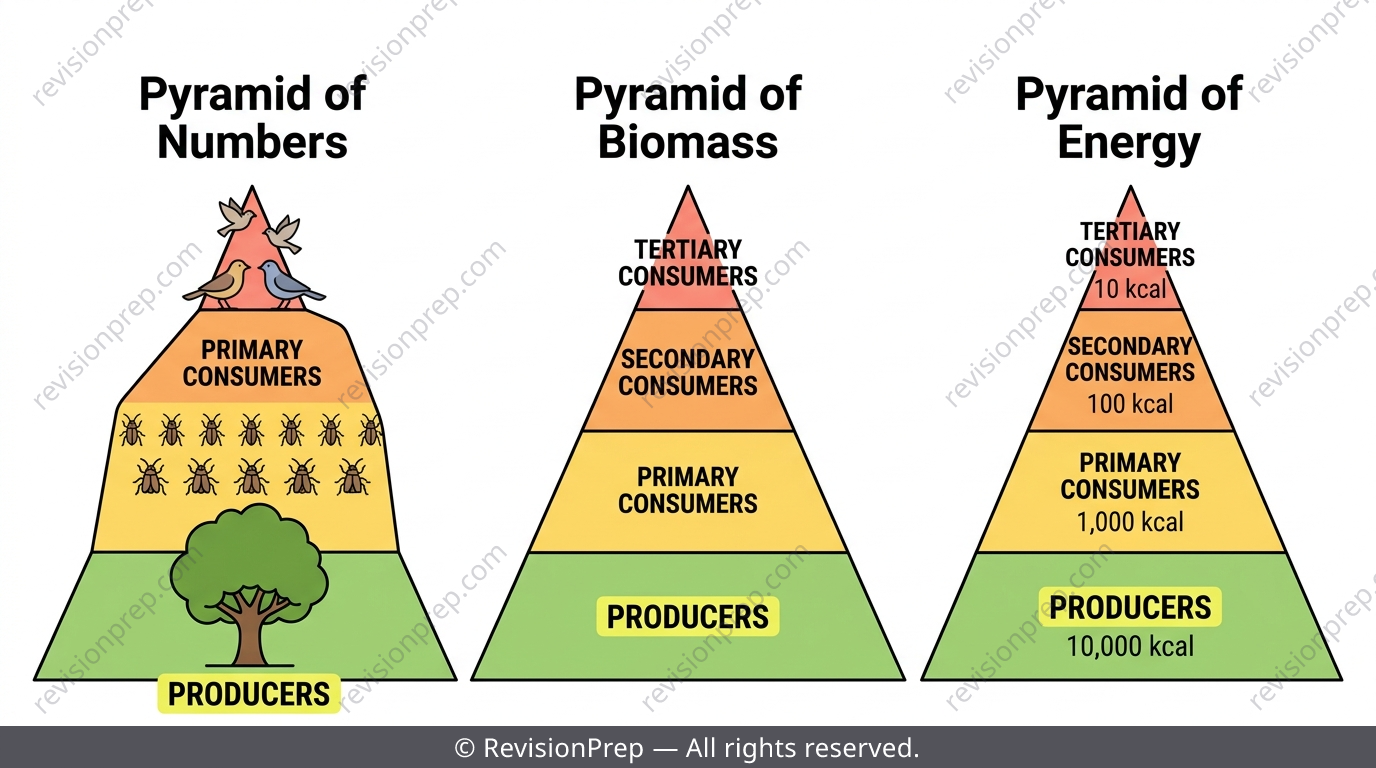
All energy in an ecosystem starts as sunlight captured by producers through photosynthesis, then flows one direction: producer to primary consumer to secondary consumer to tertiary consumer. At each step, roughly 90% of the energy is lost as heat, movement, growth, or waste — only about 10% passes on to the next level. That's why food chains rarely stretch beyond four or five links.
Exam tip
'Describe the relationship' questions on quadrat or trophic data need a quantified pattern (like a ratio or trend), not just 'as X increases, Y increases.'
Pyramids of Numbers, Biomass and Energy
A pyramid of numbers counts individual organisms at each level and can occasionally look oddly shaped — one huge tree can support thousands of insects. Pyramids of biomass measure total living mass at each level and are almost always a true pyramid shape. Pyramids of energy measure energy available in kJ and are always true pyramids, because energy loss at each transfer is guaranteed by physics, not biology.
Common mistake
Drawing the producer level at the top instead of the wide base, or adding decomposers as a level above the top consumer. Producers are always the base, and decomposers act on ALL levels rather than sitting above any single one.
Environmental Change and Pollution
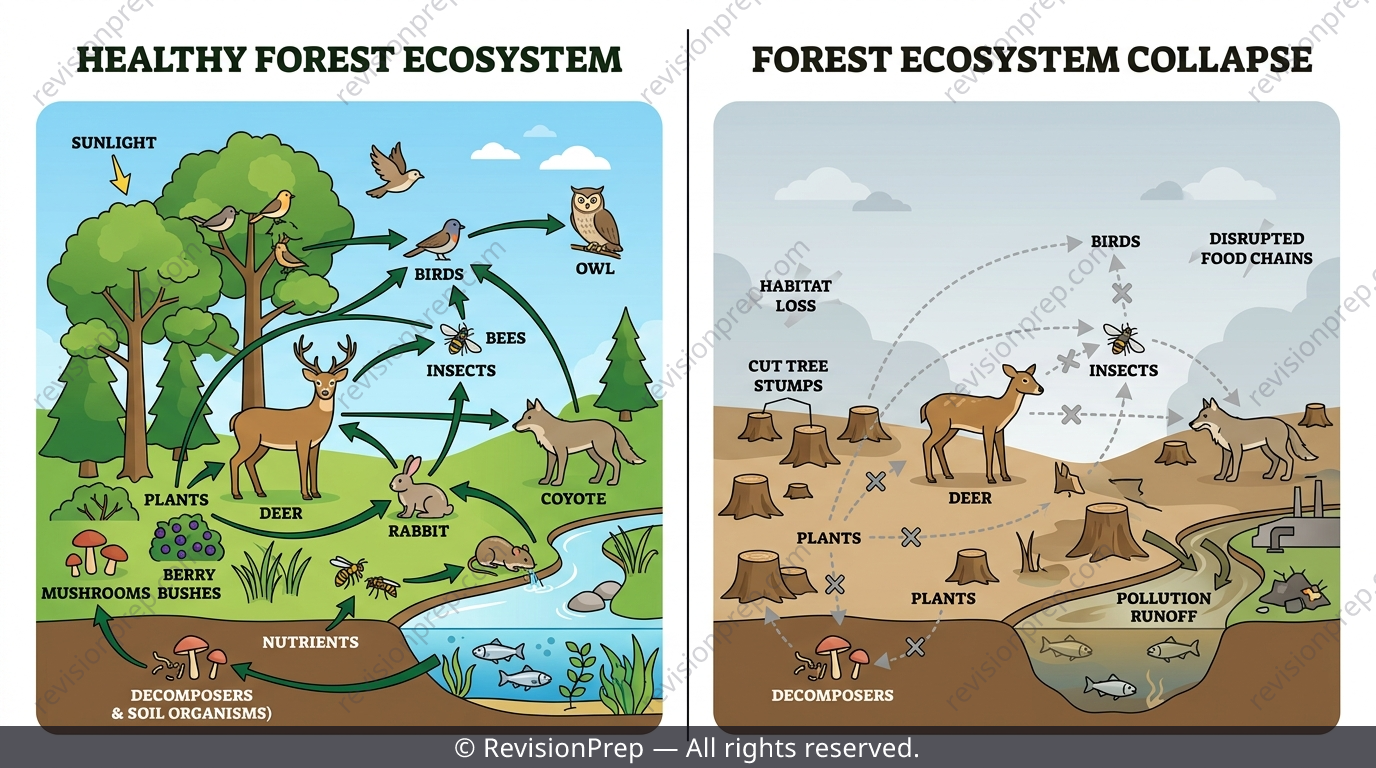
Ecosystems are balanced systems, so removing or adding one thing ripples through every trophic level. Deforestation destroys habitats and removes producers, collapsing the food chains that depend on them. Pollution — chemical, plastic, noise, or light — can poison organisms directly or disrupt their behaviour and reproduction, while climate change from greenhouse gases like CO₂ and methane shifts temperature and rainfall faster than many species can adapt to or migrate from.
Mini summary
Human disturbance rarely stays isolated to one species — it moves through the food web because every organism is connected to another.
Quick formula sheet
Practice questions
- Define the terms 'population' and 'community', and explain the difference between them.
- Give one example of a biotic component and one example of an abiotic component in a forest ecosystem.
- State the order of trophic levels in a food chain from producer to tertiary consumer.
- A pond contains fish (count = 12), algae (count = 150), water (15°C), and rocks (10°C). Identify one biotic and one abiotic component, using the data to justify your answer.
- Explain why a pyramid of numbers can sometimes look inverted while a pyramid of biomass almost never does.
- Explain why only about 10% of energy passes from one trophic level to the next, and where the rest of the energy goes.
- Quadrat counts across four sites show a consistent ratio between plant numbers and herbivore numbers. Describe this relationship in quantified terms and suggest a reason for it.
- A student says decomposers should be drawn as the top level of an ecological pyramid. Evaluate this statement using what you know about how decomposers interact with trophic levels.
- Explain how deforestation in one part of a forest ecosystem could disrupt organisms several trophic levels away, even ones not directly living in the cleared area.
Frequently asked questions
What's the difference between a habitat and an ecosystem?+
A habitat is the specific place an organism lives, like under a rock or in pond mud. An ecosystem is the whole community of living things plus the non-living surroundings they interact with — habitats exist inside ecosystems.
How do I know if something is biotic or abiotic?+
Ask only: is this thing itself alive or was it ever alive? If yes, it's biotic (even dead leaves count). If no — even if living things depend on it, like water or sunlight — it's abiotic.
Why do ecological pyramids get narrower towards the top?+
Because only about 10% of energy transfers from one trophic level to the next — the rest is lost as heat, movement, and waste — so there's less energy (and usually less biomass) available to support organisms higher up.
Can a pyramid of numbers ever look wrong-shaped?+
Yes — one large producer like a tree can support thousands of insects, giving an odd shape. Pyramids of biomass and energy don't have this problem and are almost always true pyramids.
Are decomposers a trophic level in the pyramid?+
No — decomposers aren't drawn as a level above the top consumer. They act on dead material from every trophic level, not just one, so they sit outside the pyramid structure.
How does deforestation affect a whole food web, not just the trees?+
Removing producers collapses the base of the food chain, so every consumer that depends on them — directly or indirectly — loses a food source, and the disruption ripples through multiple trophic levels.
Master Ecology and Environment for MYP 1 Sciences
Related articles