
Statistics and Probability
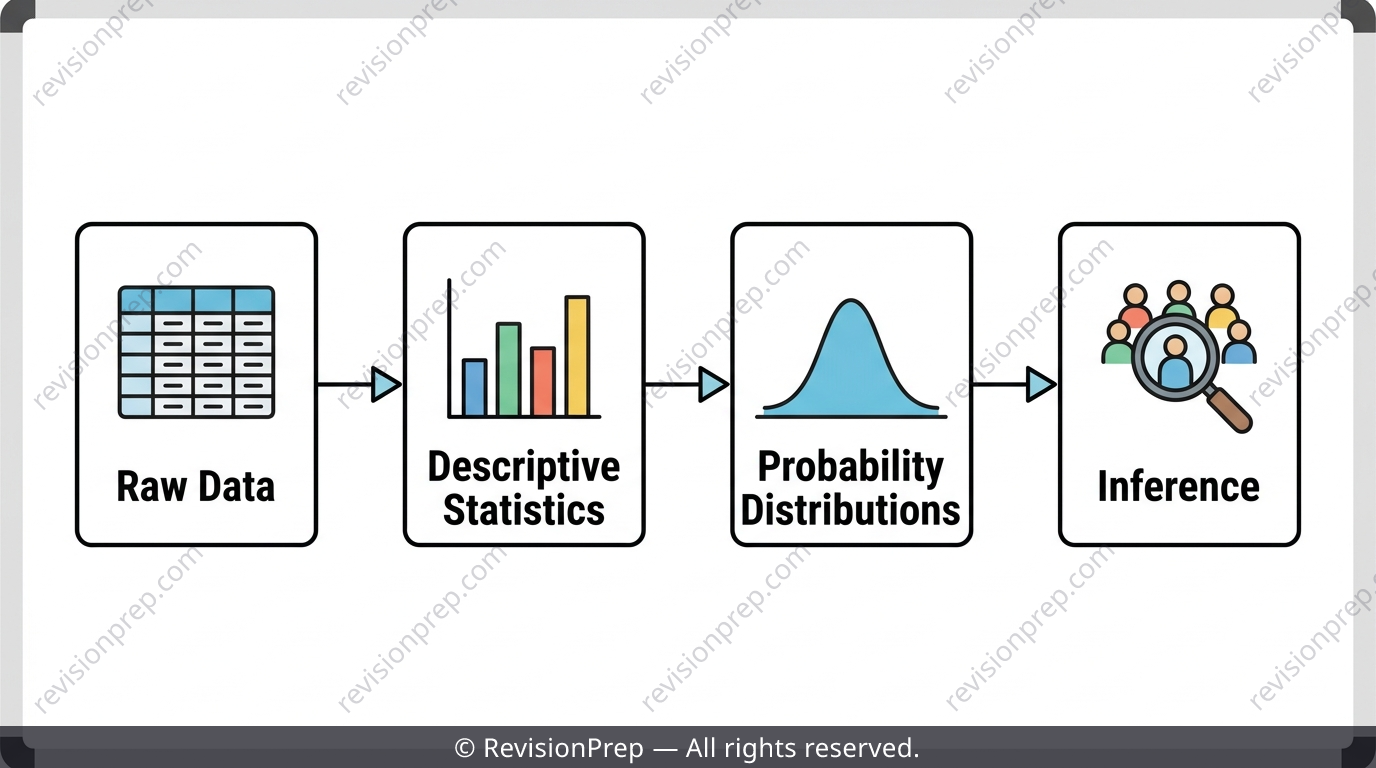
The biggest topic in AA HL, mapped out: descriptive stats, probability rules, distributions and inference in one flow
Quick facts
Statistics and Probability is the single largest topic in IB DP Maths AA, worth around 30% of AA HL and a favourite for Paper 3 investigations. It can feel huge because it actually contains four different skill sets stitched together: describing data you already have, modelling how random processes behave, and using samples to make claims about populations. Students lose marks not because the maths is hard, but because they mix up which stage of the chain a question is asking about — using population language in a descriptive question, or forgetting that grouped-data quartiles are only ever estimates. This teaser walks through the five ideas that generate the most exam marks: the overall flow of the topic, estimating grouped-data statistics, the variance divisor trap, the core probability rules including Bayes' theorem, and the key distributions (binomial, Poisson, normal). The full revision notes go much deeper into every worked example and formula.
What you’ll be able to do
The One Flow That Explains Every Question
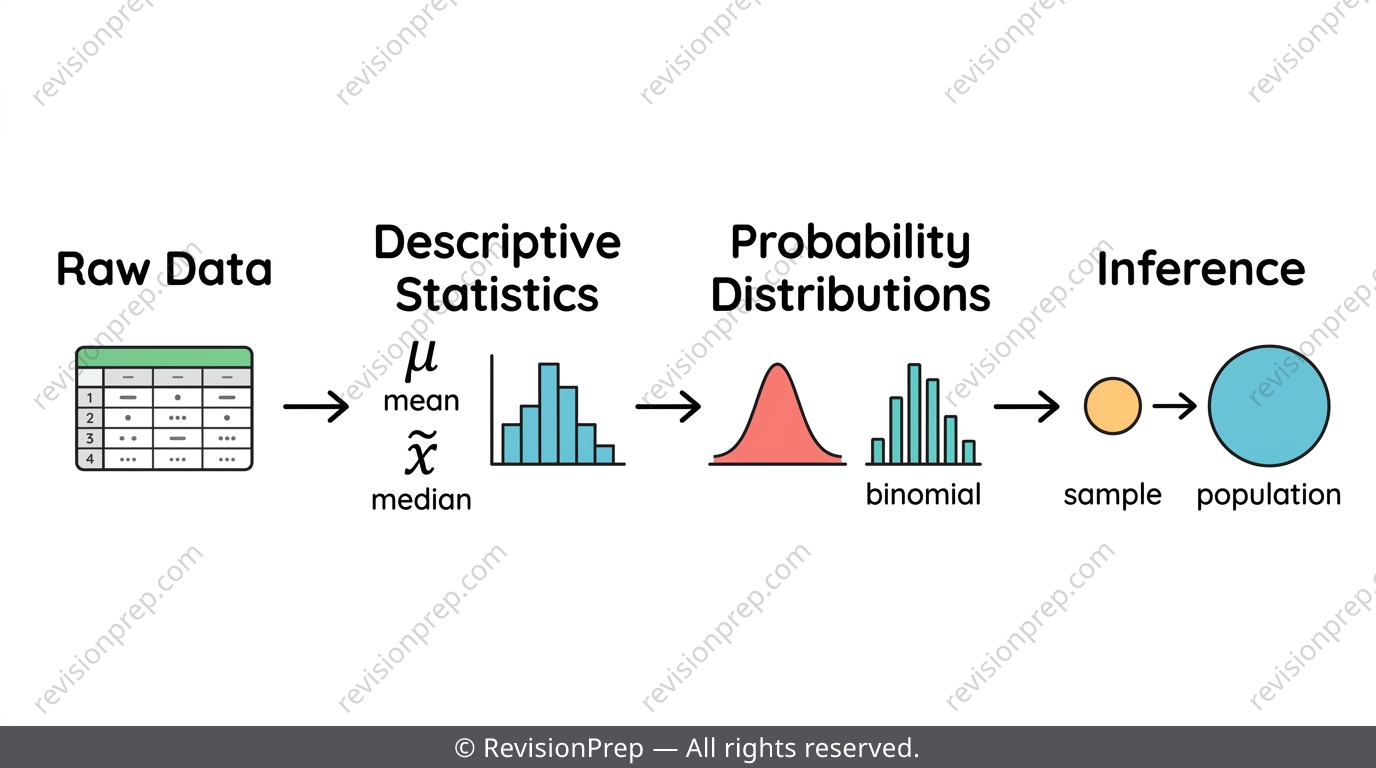
Everything in this topic moves in one direction: raw data → descriptive statistics → probability distributions → inference about a wider population. The command term in a question tells you exactly where you sit on that chain. Descriptive statistics only describes the numbers you were given and never mentions 'the population'; distributions are theoretical models you plug parameters into; inference is the only place 'estimate' genuinely applies to something beyond your data.
Mini summary
Work out which stage of the chain a question is testing before you pick a formula.
Grouped Data: Estimating the Median and Quartiles
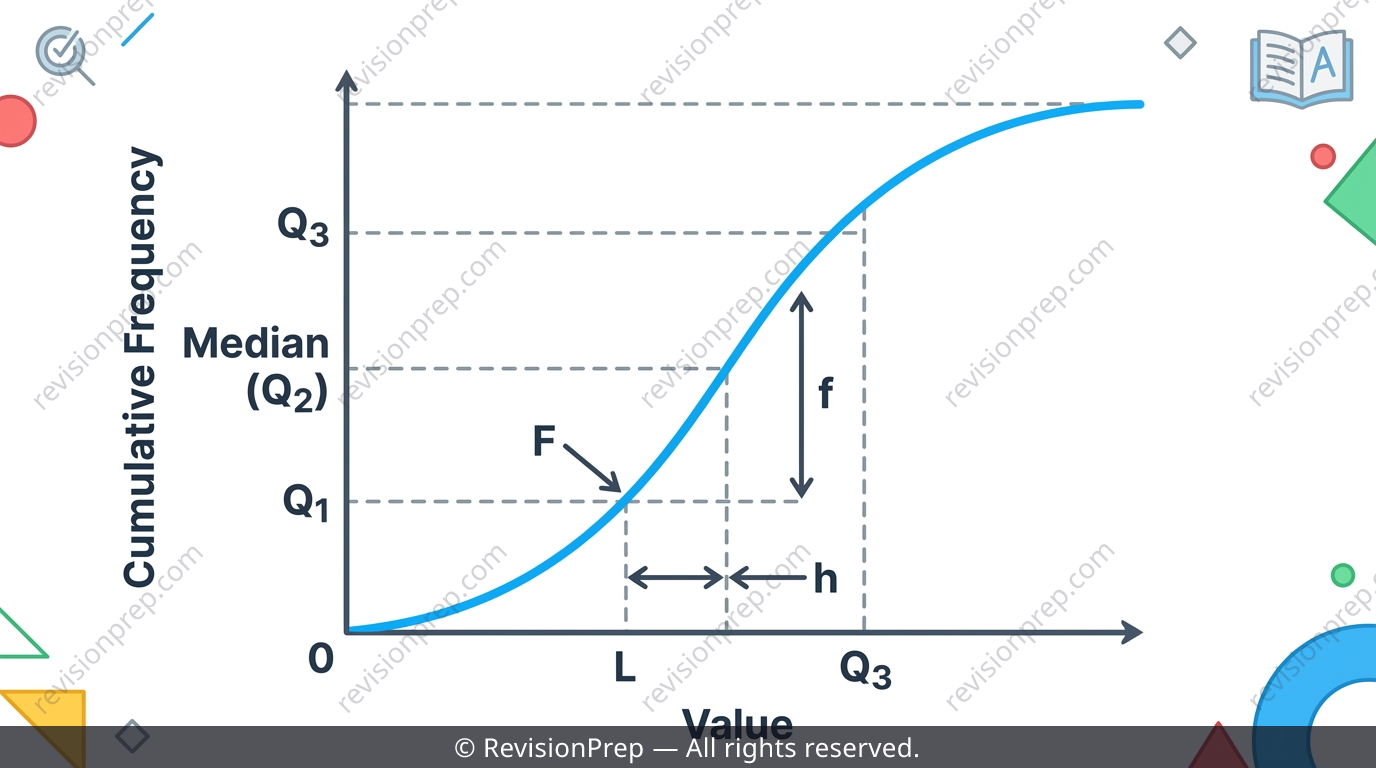
For grouped/continuous data you never have the raw values, so the mean uses mid-interval values and the median and quartiles must be estimated using the cumulative frequency formula . This is the most heavily tested grouped-data skill on Paper 2. Box plots come straight from the 5-number summary, and a value counts as an outlier only if it lies beyond or — state this rule explicitly whenever asked to check for outliers.
Exam tip
Re-identify , , and separately for each quartile you calculate — don't reuse values from the median calculation.
Common mistake
Using the wrong cumulative frequency for — it must be the total strictly BEFORE the class you've identified, never the running total that includes it.
Variance and Standard Deviation: n vs n-1
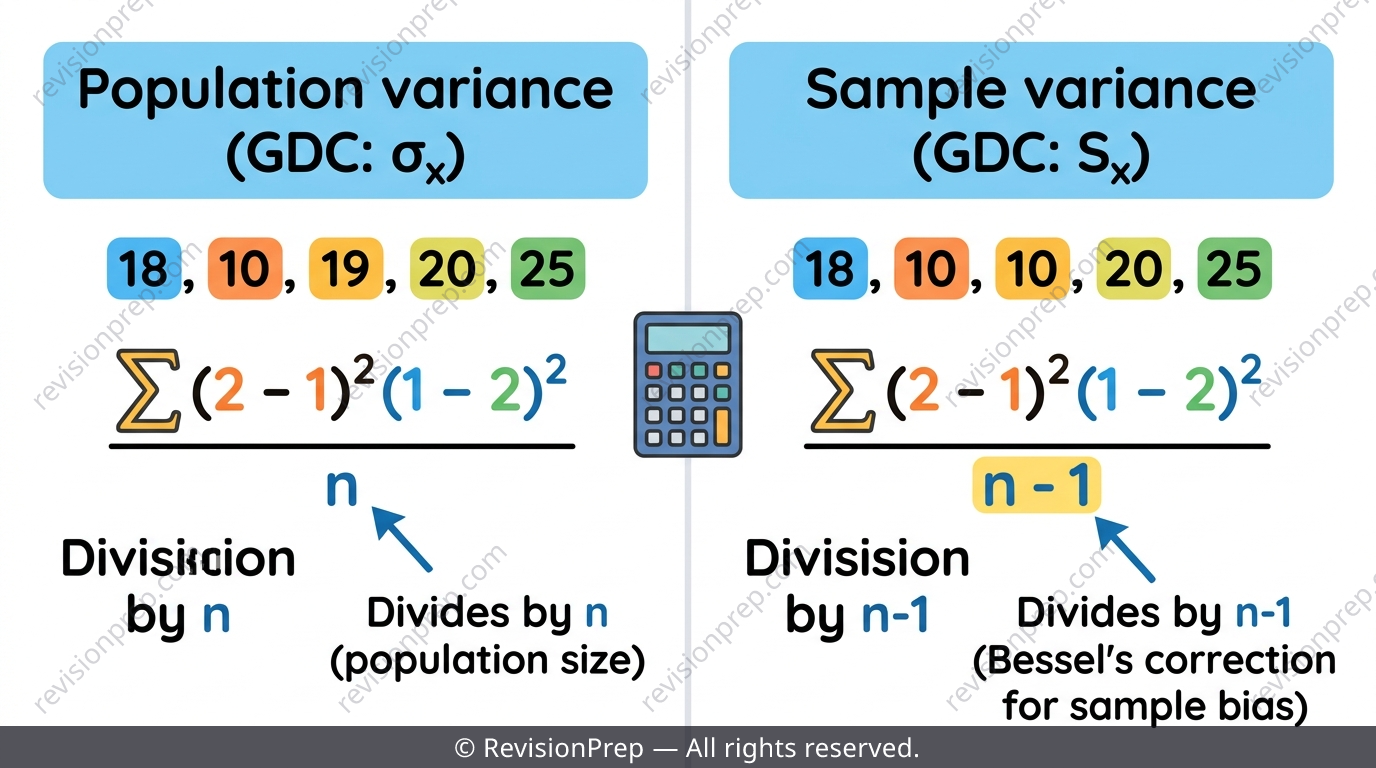
The population-style formula treats your data as the whole population, while the unbiased sample estimate is . In exam wording, 'sample variance' always means divide by . If a new data point is added, there is no valid shortcut — you must recompute the mean from the new total and then rebuild every deviation from scratch.
Exam tip
For 'show that' variance questions, write out the raw sum and the sum of squared deviations explicitly before dividing — a GDC-only final answer can score 0/4 even if it matches.
Common mistake
Trying to 'update' variance with a shortcut when a new value is added instead of fully recalculating the mean and every deviation.
Probability Rules: Independence, Conditional Probability & Bayes' Theorem (HL)
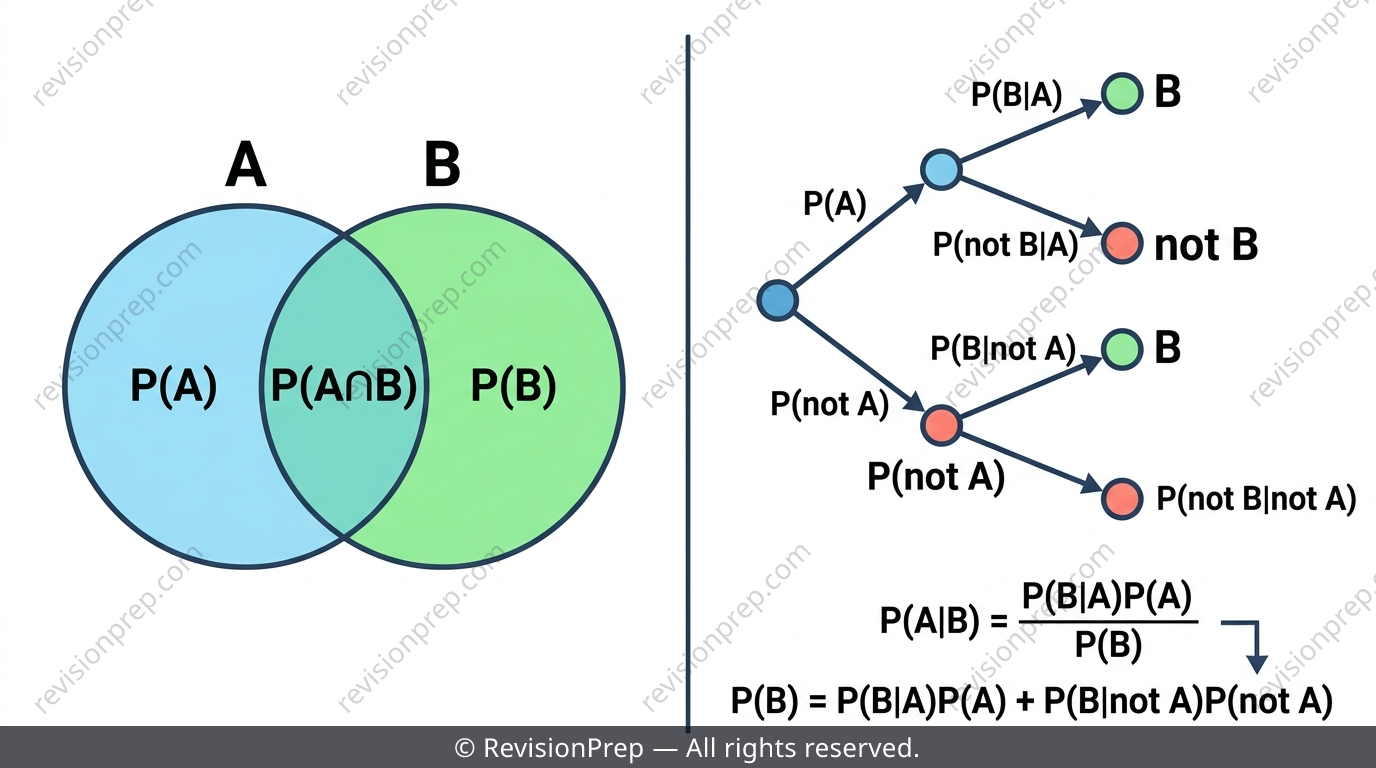
The addition rule always holds and only simplifies for mutually exclusive events. Conditional probability is the algebra Bayes' theorem is built from, and independence must always be tested numerically using — never assumed from the story. Bayes' theorem (HL) reverses a conditional probability, turning 'probability of the effect given the cause' into 'probability of the cause given the effect'.
Exam tip
If a question gives you and asks for , that's your signal to reach for Bayes' theorem.
Common mistake
Assuming two events are independent because the question 'sounds' like they should be, instead of checking numerically.
Probability Distributions: Binomial, Poisson & Normal
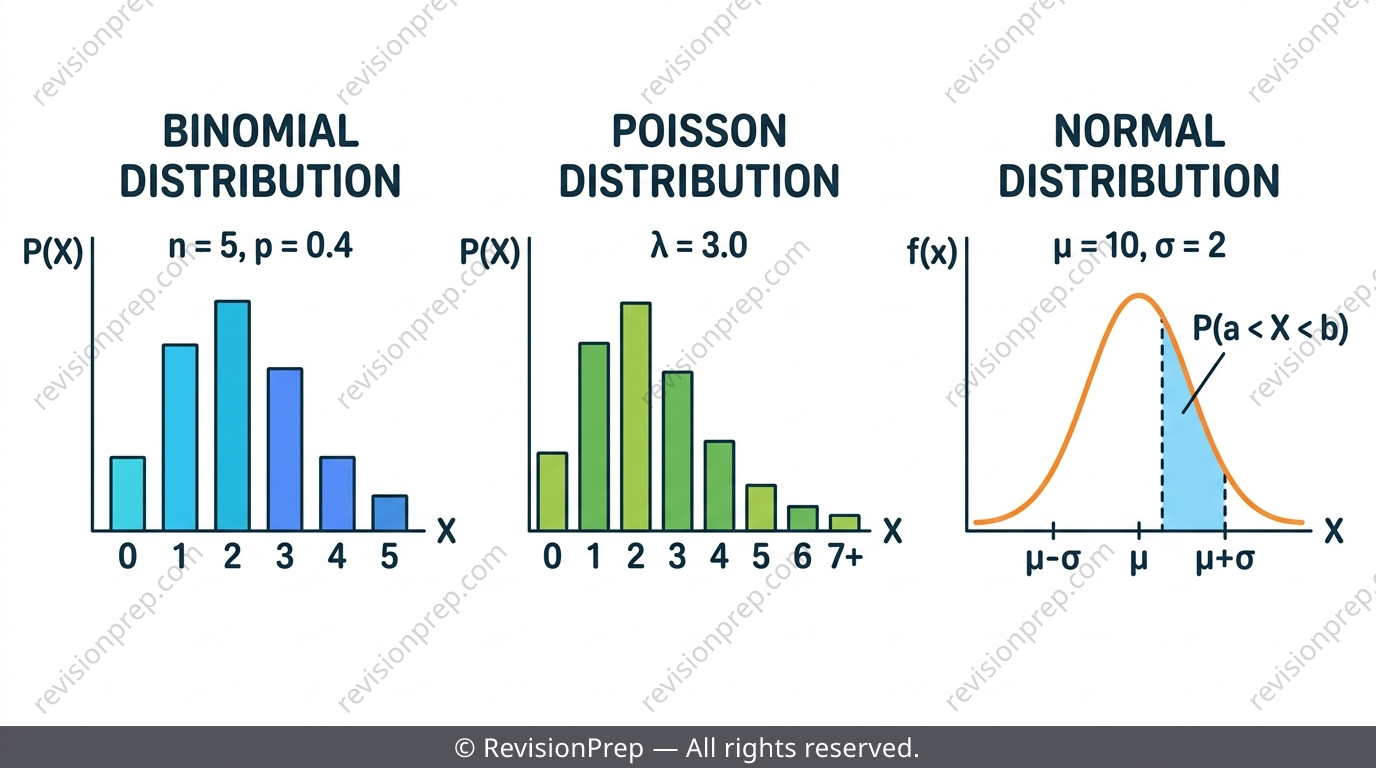
Binomial needs four conditions — fixed trials, two outcomes, constant , independence — with mean and variance . Poisson (HL only) models random events at a constant average rate over a fixed interval, uniquely with mean equal to variance. The normal distribution is continuous and symmetric, described fully by and , solved mostly on the GDC but standardised by hand using . At HL, the algebra of random variables lets you combine independent variables: variance always ADDS, even for a difference.
Exam tip
Before reaching for the GDC normal cdf, check whether the question actually wants you to standardise by hand — some command terms require showing the z-value.
Common mistake
Assuming for independent variables — variance always adds, never subtracts.
Quick formula sheet
Practice questions
- State whether 'number of cars passing a checkpoint per hour' is discrete or continuous data.
- Write down the addition rule for for two events A and B.
- State the four conditions required for a binomial distribution.
- A grouped frequency table has 60 data values. Explain how you would find , , and to estimate the lower quartile.
- Two events A and B have , and . Determine whether A and B are independent.
- Explain why the sample variance formula uses while the population variance formula uses .
- A new data value is added to a sample of 10, changing the mean from 18 to 19. Explain why you cannot simply adjust the old variance and must recompute it fully.
- Given , and , use Bayes' theorem to find .
- For two independent random variables X and Y, explain why rather than the variances subtracting.
Frequently asked questions
What's the difference between population variance and sample variance in IB Maths AA?+
Population variance divides by and treats your data as the entire group of interest, while sample variance divides by and is used whenever the exam wording says 'sample' — this gives an unbiased estimate of the wider population's variance.
How do you estimate the median from grouped data?+
Use the cumulative frequency formula with , making sure is the cumulative frequency strictly before the median class, not including it.
When do I use Bayes' theorem instead of basic conditional probability?+
Use Bayes' theorem when you're given a conditional probability in one direction, like , but the question asks for the reverse, — this typically happens in 'cause and effect' style questions.
Why does variance add even when you subtract two independent random variables?+
Variance measures spread, and combining two independent sources of variability — whether by adding or subtracting the variables — always increases total uncertainty, so .
What makes Poisson different from binomial in IB Maths AA HL?+
Poisson models the number of independent random events occurring at a constant average rate over a fixed interval, and uniquely its mean and variance are both equal to , unlike binomial where mean and variance differ.
How do I know if two events are independent?+
Never assume independence from the context of a question — always test it numerically by checking whether .
Get the Complete Statistics and Probability Revision Notes
Related articles