
Statistics and Probability: IB Maths AA SL Made Simple
Descriptive stats, transformations, and probability rules — the exam-guaranteed topic explained clearly.
Quick facts
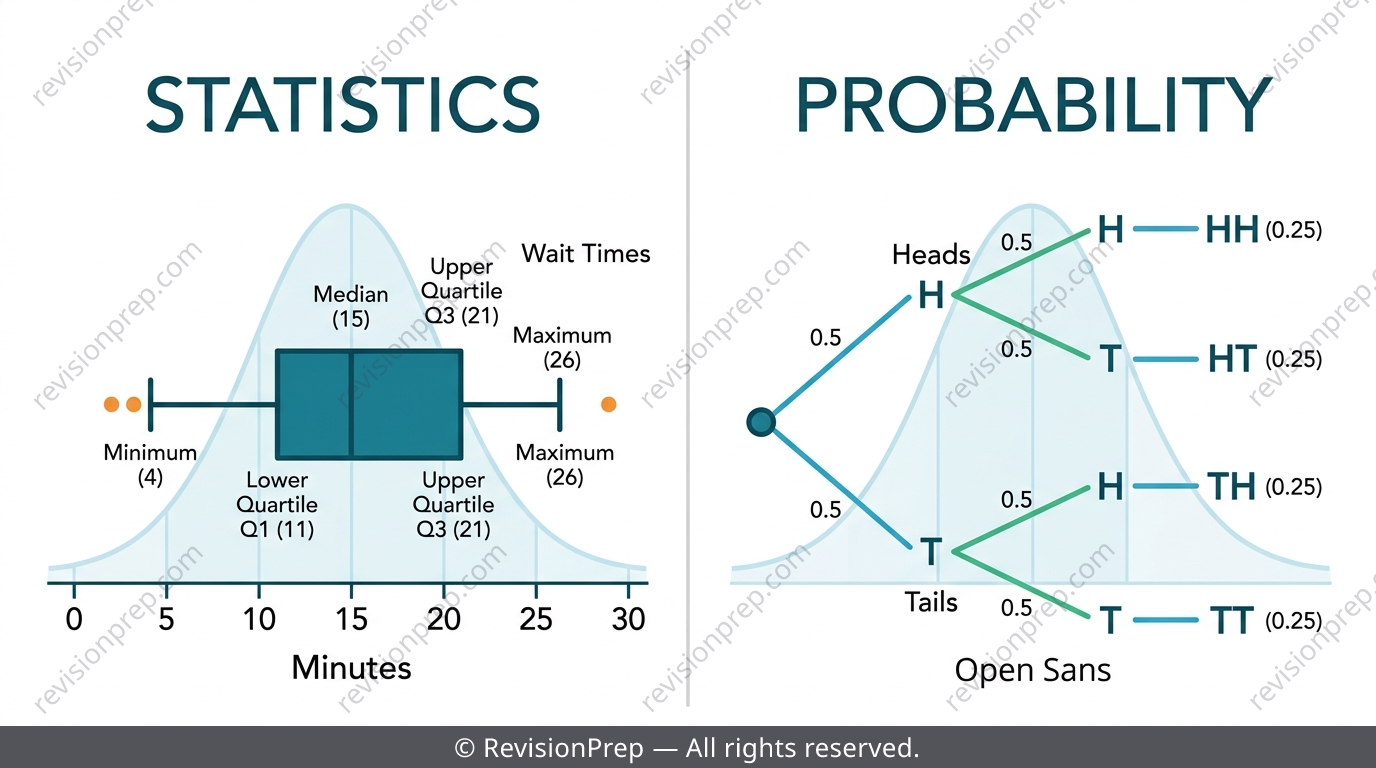
Statistics and Probability makes up roughly 22% of IB Maths AA SL and is guaranteed to appear on both Paper 1 and Paper 2, so it's a topic you cannot afford to leave half-revised. At its core, every question is testing one of three skills: describing a single data set with mean, median and spread; modelling chance with probability rules; or comparing two data sets through box plots. Almost all of it is calculator-active, which means the real marks are won in the reasoning — explaining why a mean shifts, why the standard deviation changes, or why two events can't be both mutually exclusive and independent. This teaser walks through the five ideas that show up most often in IB Maths AA SL statistics and probability exam-style questions, from linear transformations to tree diagrams, so you know exactly what to lock in before exam day.
What you’ll be able to do
Population, Sample, and Choosing the Right Measure of Centre
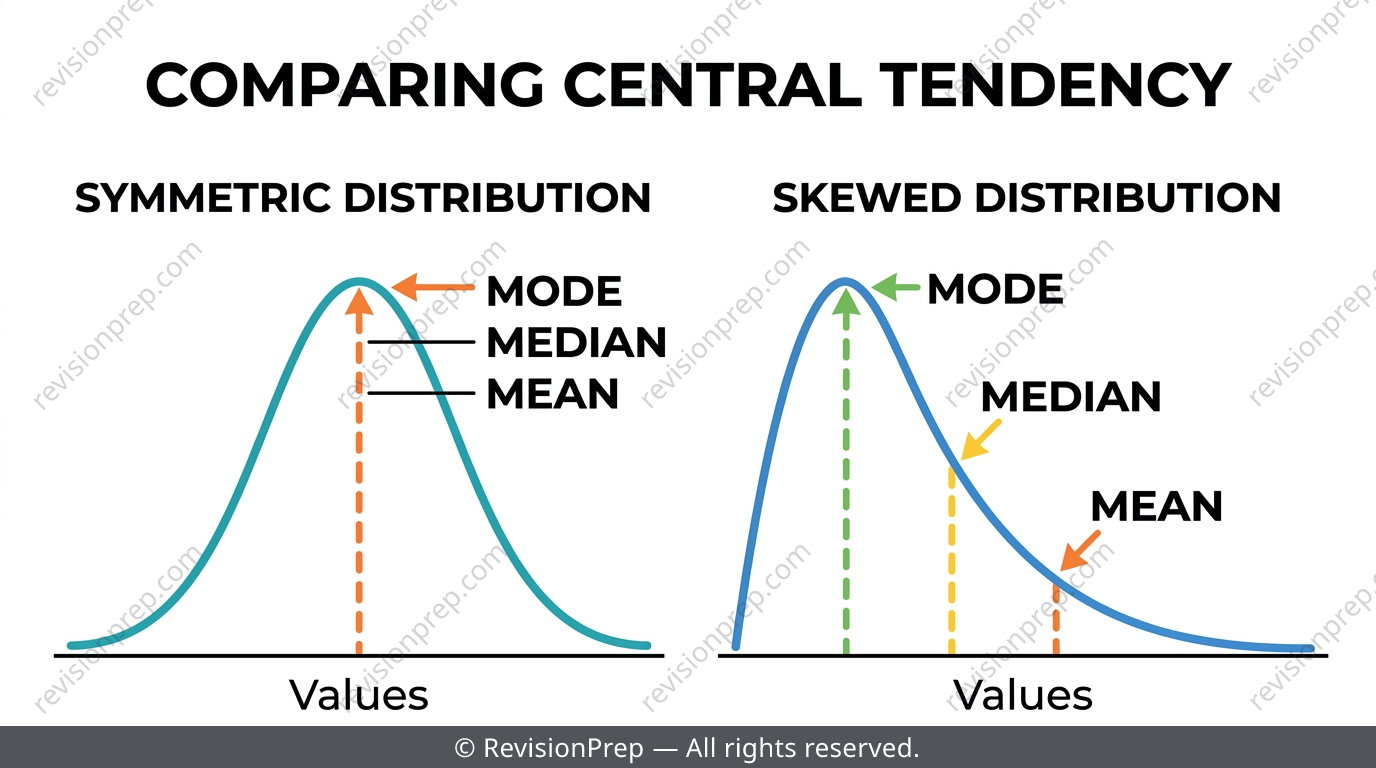
A population is every member of the group you care about; a sample is the subset you actually measured, and almost every exam data set is a sample. Mean, median and mode each answer a different question: the mean uses every value and is sensitive to outliers, the median only cares about position and is robust to outliers, and the mode suits categorical or repeated discrete data. For an odd number of values the median is the middle sorted value; for an even number it's the average of the two middle values.
Exam tip
When a question asks for 'the standard deviation' of a full data set, use σx from your calculator, not sx — quoting sx gives a value that's close but technically wrong to the required significant figures.
Common mistake
Picking mean by default in a 'which measure is best' question without checking for skew or outliers first.
Mini summary
Match the measure of centre to the shape of the data, and always justify the choice in context.
Grouped Data, Midpoints and Histogram Area
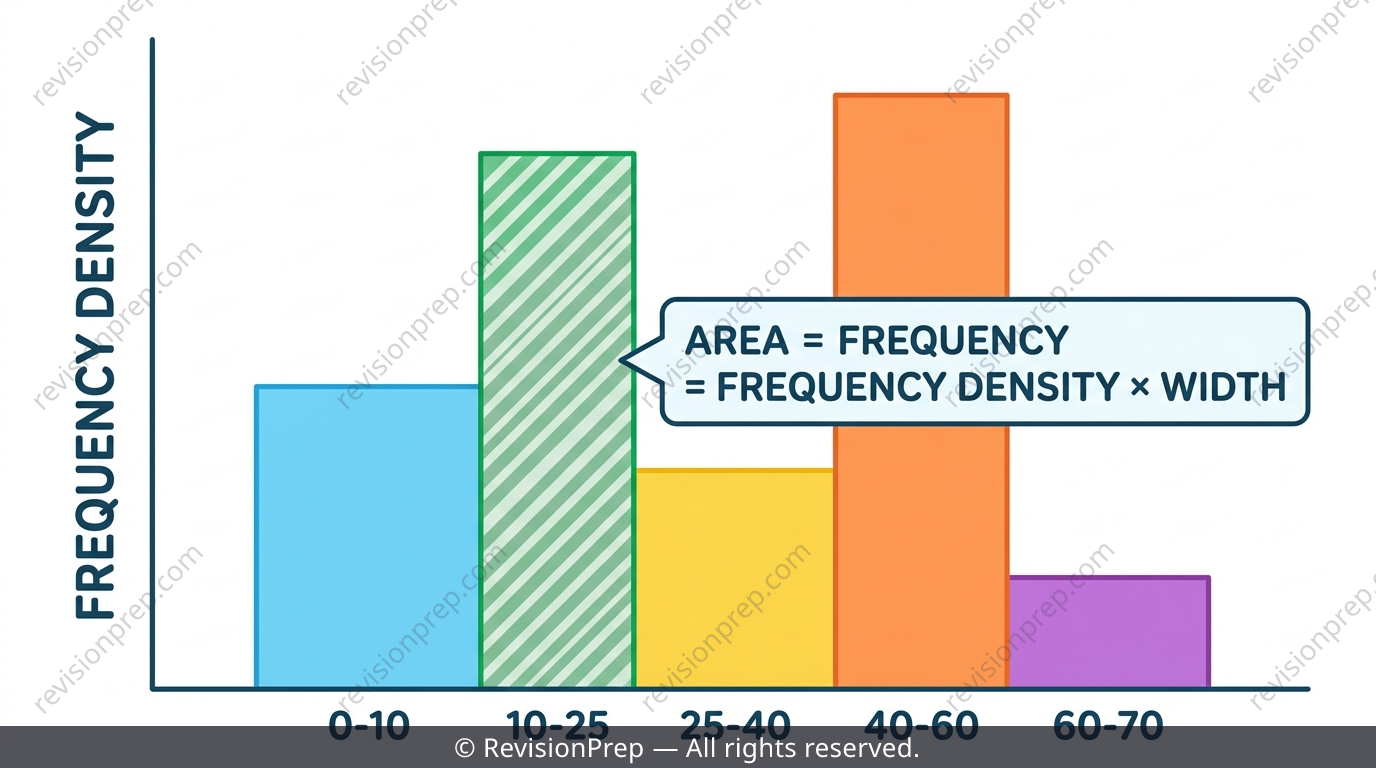
When data is grouped into a frequency table, the class midpoint stands in for every value in that class when calculating the mean or standard deviation — this makes the result an estimate, not the exact figure, because individual values are lost. In a histogram with unequal class widths, it's the area of each bar (frequency density × width) that represents frequency, not the bar's height alone. The modal class of grouped data is therefore the class with the highest frequency density, not simply the highest raw frequency, whenever widths differ.
Exam tip
Before reading off the modal class from a histogram, check the class widths are equal — if not, compare frequency density, not frequency.
Common mistake
Naming the tallest bar as the modal class without checking whether class widths are unequal.
Mini summary
Midpoints estimate grouped means; area (not height) represents frequency on unequal-width histograms.
Linear Transformations and the Sum Shortcut
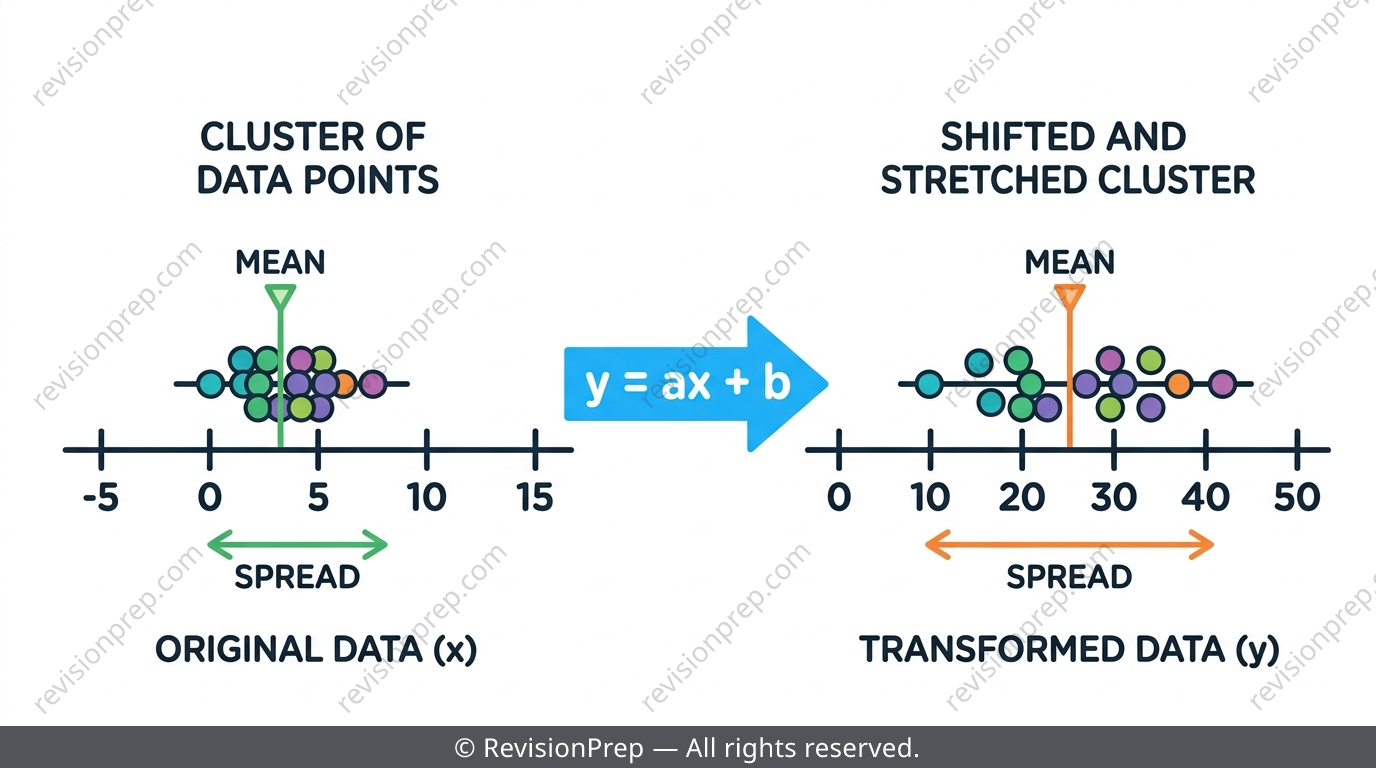
If every value in a data set is transformed as , the new mean becomes and the new variance becomes — adding a constant shifts the mean but never changes the spread, while multiplying scales both mean and SD. When a single value is corrected (not a full transformation), adjust by the difference between the correct and incorrect value and divide by again, rather than re-adding everything. Adding one new data point equal to the current mean always leaves the mean unchanged but slightly reduces the variance.
Exam tip
Whenever a question says 'without recalculating', it wants a / shortcut argument, not a guessed direction.
Common mistake
Re-adding every data point from scratch when the question explicitly gives a shortcut structure like a corrected value or one new data point.
Mini summary
Store and as running totals — they unlock every 'without recalculating' question.
Spread, Outliers, and Comparing Box Plots
Range (max − min) is quick to calculate but wrecked by a single extreme value; the interquartile range describes the spread of the middle 50% and ignores extremes. A value is flagged as an outlier if it falls below or above — this labels it as unusual, it doesn't automatically get deleted. The five-number summary (min, Q1, median, Q3, max) builds a box plot, and comparing two box plots properly means using SOCS: shape, outliers, centre, and spread.
Exam tip
Use IQR instead of range whenever a data set might contain outliers — it gives a fairer picture of consistency.
Common mistake
Comparing two box plots by only stating which median is bigger, ignoring IQR and skew, when the command term asks to 'compare'.
Mini summary
SOCS — shape, outliers, centre, spread — is the checklist for any box plot comparison question.
Probability Rules: Complements, Mutually Exclusive and Independent Events
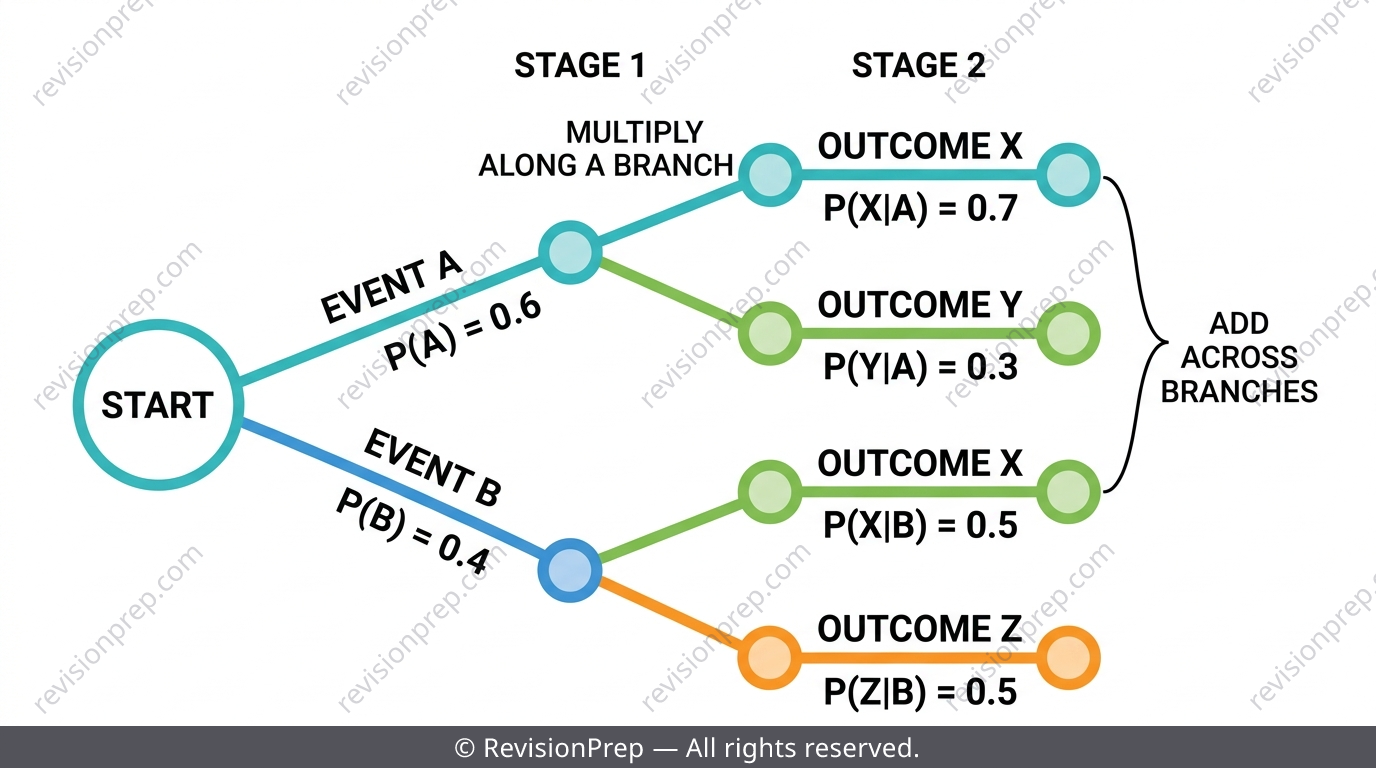
For equally likely outcomes, , and the complement rule is the fastest route through any 'at least one' question. Mutually exclusive events satisfy , while the general addition rule always holds and corrects for double-counting the overlap. Independent events satisfy , and in tree diagrams you multiply along a branch for one path but add across branches when several paths lead to the same outcome.
Exam tip
If asked whether two events are independent AND mutually exclusive, test both definitions separately — mutually exclusive events with nonzero probabilities can never be independent.
Common mistake
Confusing relative frequency (an observed proportion) with theoretical probability, especially in 'comment on' style questions.
Mini summary
Venn diagrams, tables and tree diagrams organise the same probability information — choose based on the question's structure.
Quick formula sheet
Practice questions
- Explain the difference between a population and a sample in the context of a survey of 50 students out of a school of 800.
- For the data set 4, 7, 9, 12, 15, find the median and state whether it is robust to outliers.
- State the complement rule and use it to find P(A') if P(A) = 0.35.
- A data set has mean 20 and variance 9. Every value is transformed using y = 2x - 3. Find the new mean and new variance.
- A histogram has unequal class widths. Explain why you cannot identify the modal class just by comparing bar heights.
- Two events A and B satisfy P(A) = 0.4, P(B) = 0.3, and P(A ∩ B) = 0.12. Determine whether A and B are independent.
- A sample of 8 values has ∑x = 96. One value recorded as 15 should have been 21. Find the corrected mean without re-adding all values.
- Two box plots summarise dissolution times for Formulation X and Formulation Y. Using SOCS, explain how you would compare their consistency and skew.
- A new data point equal to the current mean is added to a data set of 10 values. Explain, using the variance formula, why the variance must decrease.
Frequently asked questions
How much of IB Maths AA SL is Statistics and Probability?+
It's roughly 22% of the SL syllabus (about 33 of 150 teaching hours) and is guaranteed to appear on both Paper 1 and Paper 2.
Is IB Maths AA SL statistics calculator-based?+
Yes, almost all of it is calculator-active — you're expected to use 1-Var/2-Var Stats and similar functions fluently, but reasoning marks still require written justification.
What's the difference between σx and sx on my calculator?+
σx is the standard deviation of the data set itself; sx is the sample estimate of a population's standard deviation. For 'the standard deviation of this data set' questions at SL, use σx.
Does AA SL include hypothesis testing or confidence intervals?+
No — at AA SL, 'inference' means using correlation and regression to describe and predict; formal hypothesis testing isn't part of the syllabus.
Why does adding a constant to every value not change the standard deviation?+
Adding a constant shifts every value (and the mean) by the same amount, so the distances between values and the mean — and therefore the spread — stay exactly the same.
Can two events be both mutually exclusive and independent?+
Only if one of them has probability zero. Otherwise, mutually exclusive events (which can't both happen) automatically fail the independence test.
Get the Full IB Maths AA SL Statistics and Probability Notes
Related articles