
Statistics and Probability
The biggest AI SL topic, decoded: confidence intervals, hypothesis tests, chi-squared and correlation in one place.
Quick facts
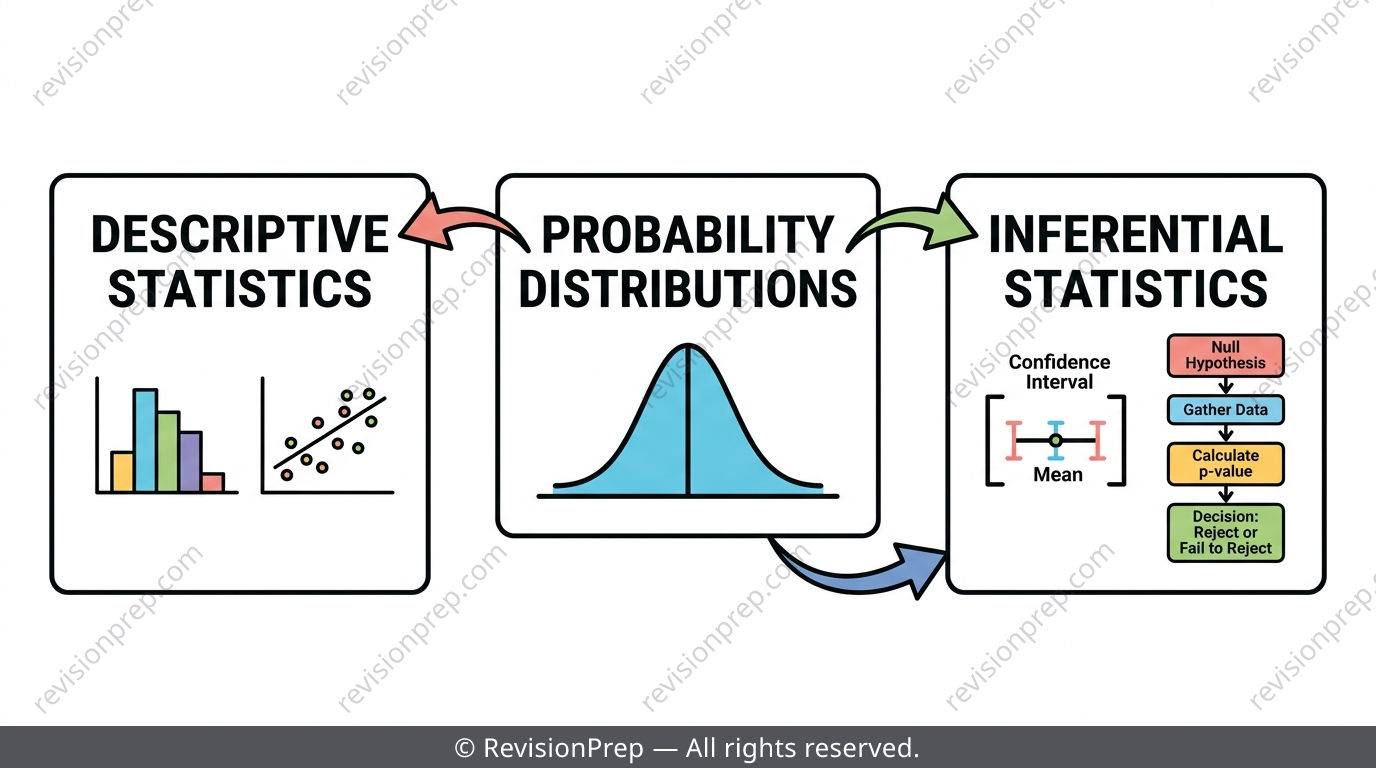
Statistics and Probability is the single biggest topic in IB Maths AI SL, and it shows up in almost every exam paper — usually as one full 15-20 mark question plus smaller parts scattered elsewhere. The good news is that your GDC does the heavy computation: regression coefficients, , , -values and confidence intervals all come from a button press. The actual skill being tested is setting up the right calculation and writing a conclusion that references the scenario, not generic maths. This teaser walks through the five ideas that come up most often — descriptive statistics for grouped data, correlation and regression, confidence intervals, one-sample hypothesis tests, and the chi-squared test for independence — with the common mistakes examiners flag every year. For the full worked examples, formula derivations and practice sets, the complete revision notes are linked below.
What you’ll be able to do
Descriptive Statistics: Grouped Data, Spread and Outliers
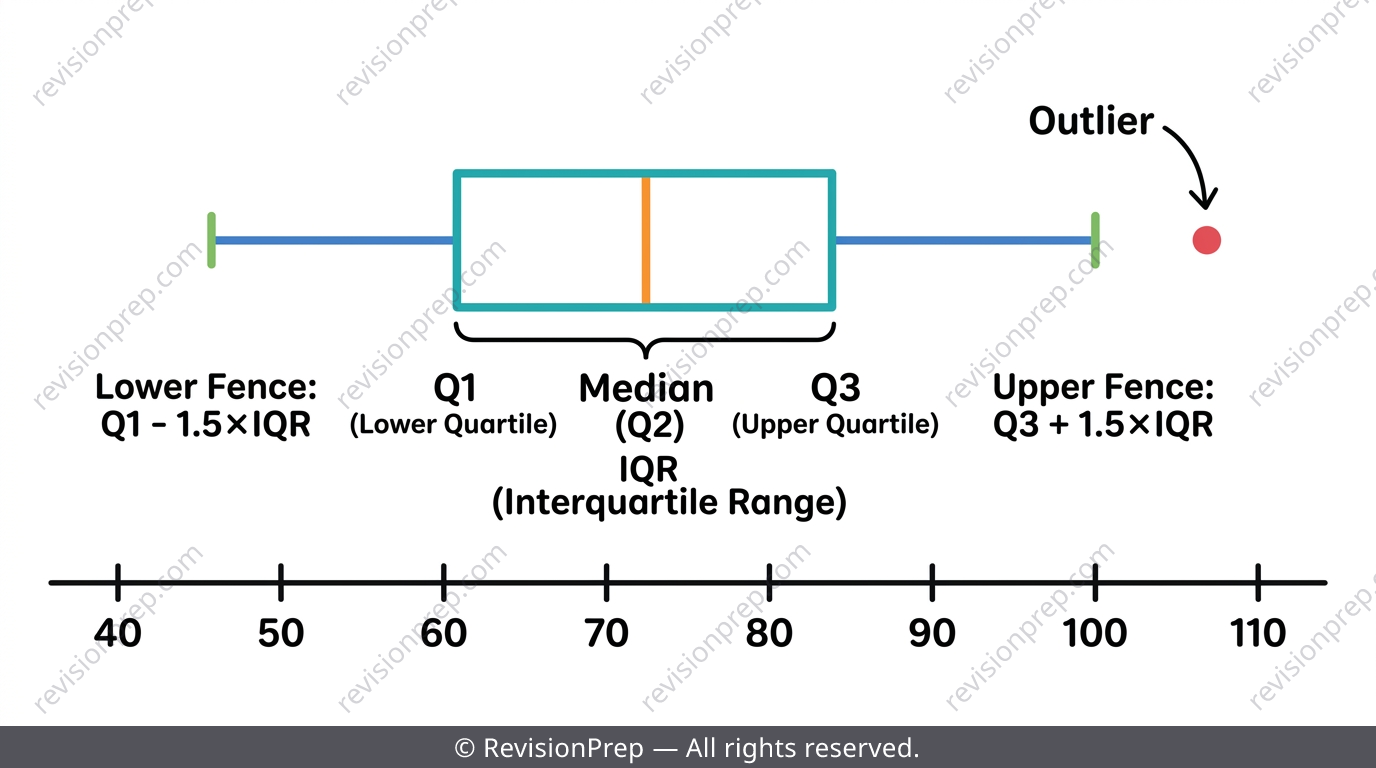
For grouped or continuous data, you can't recover the raw values, so the mean is always an estimate using class midpoints: . The interquartile range () is a more robust measure of spread than the range because it ignores the extreme 25% at each end where outliers live. An outlier is formally anything below or above — this is exactly the fence your GDC uses to plot separate points on a box plot.
Exam tip
Remember grouped-data means and variances are estimates — say so explicitly if a question asks you to justify precision.
Mini summary
Grouped data → midpoint estimates; IQR and the 1.5×IQR fence define spread and outliers.
Correlation and Regression
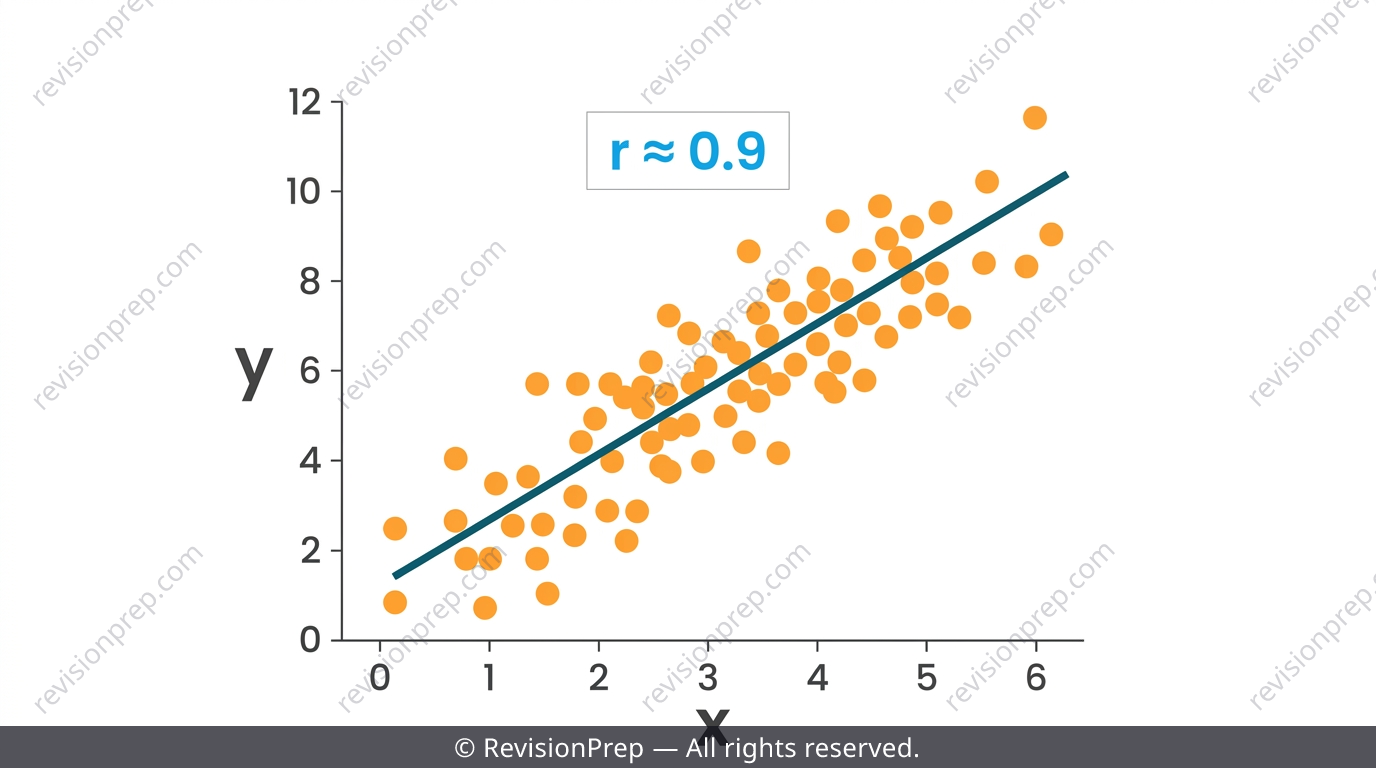
Bivariate data uses a scatter diagram to spot a linear trend, and Pearson's correlation coefficient quantifies its strength, ranging from to . The exam rarely tests the calculation itself — the GDC gives you instantly — it tests whether you can interpret and the regression equation in the context of the question rather than just quoting numbers.
Common mistake
Quoting or the regression line without ever relating it back to what the variables actually represent in the scenario.
Mini summary
measures strength/direction of linear correlation; always interpret it in context, not just numerically.
Confidence Intervals: z vs t
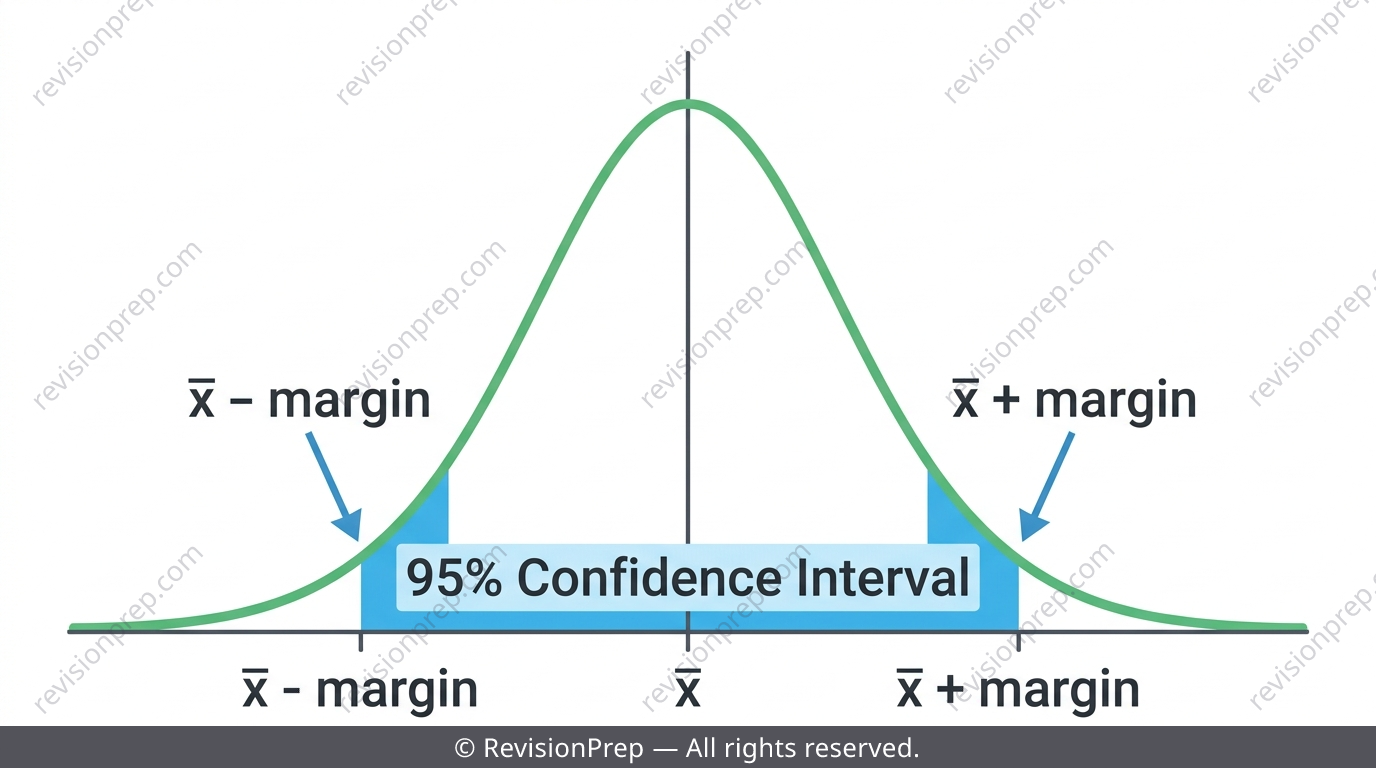
A confidence interval is a range, built from your sample, expected to contain the true population mean with a stated level of confidence. Use only when the population standard deviation is explicitly given; otherwise use — the far more common IB case, since real samples almost never come with a known .
| Feature | z-test / z-interval | t-test / t-interval |
|---|---|---|
| Standard deviation used | Population (given) | Sample (estimated) |
| When to use | explicitly stated as known | unknown — most IB questions |
| Degrees of freedom | Not applicable |
Exam tip
Ask yourself first: 'Is given, or am I estimating it from sample data?' That single question decides or .
Common mistake
Plugging the GDC's population-style standard deviation (, shown as ) into the CI formula instead of the unbiased — this silently understates the interval width.
Mini summary
known → -interval; unknown (the usual case) → -interval with .
Hypothesis Testing on a Single Mean
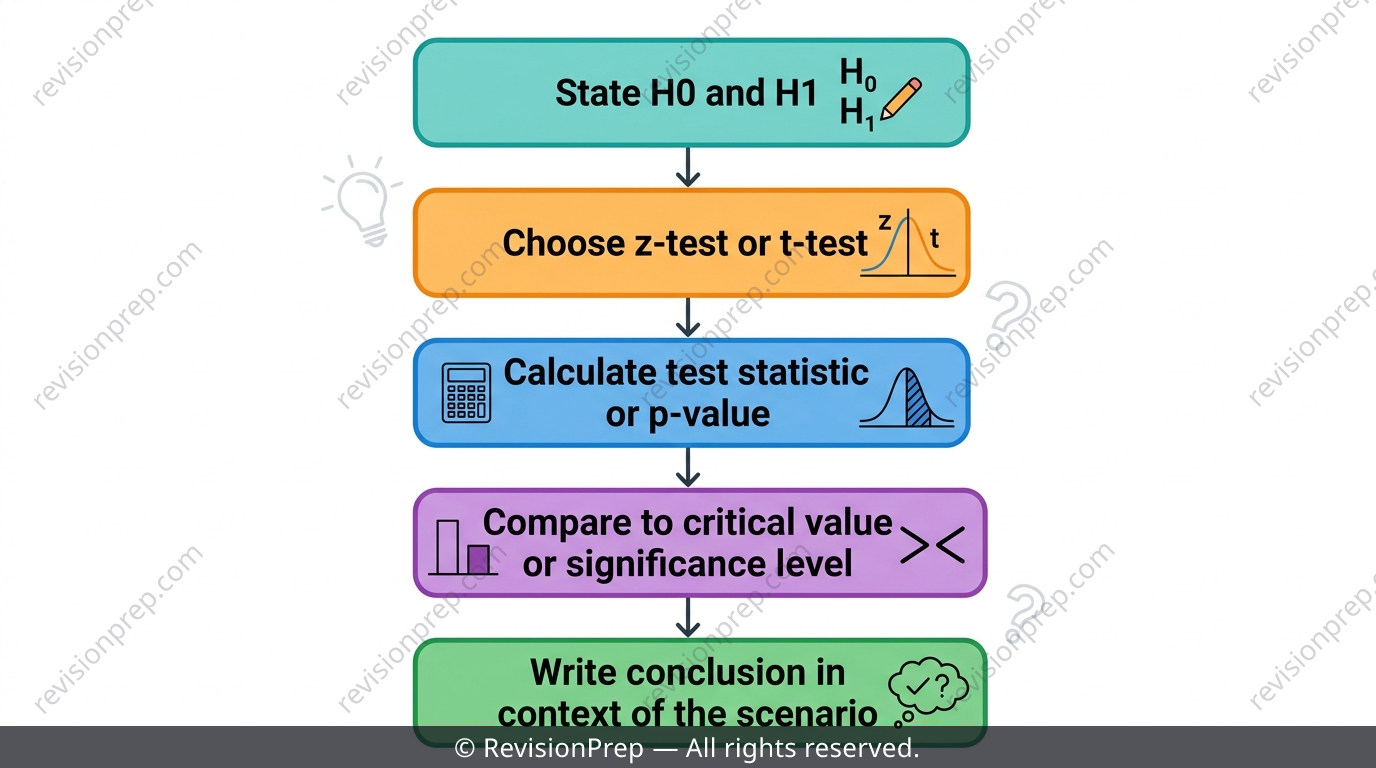
always contains an equals sign (e.g. ), while 's direction — , , or — is read straight from the wording of the claim. You compare either the test statistic to a critical value, or the -value to the significance level (often 0.05), but never mix the two comparisons in one answer.
Exam tip
Decide one comparison method per question — statistic vs critical value, OR p-value vs α — and stick to it throughout your working.
Common mistake
Writing something like '' — comparing a test statistic directly to a probability is meaningless and flags a conceptual gap to examiners.
Mini summary
has '=', 's direction comes from the claim's wording; never compare a statistic to a probability.
Chi-Squared Test for Independence
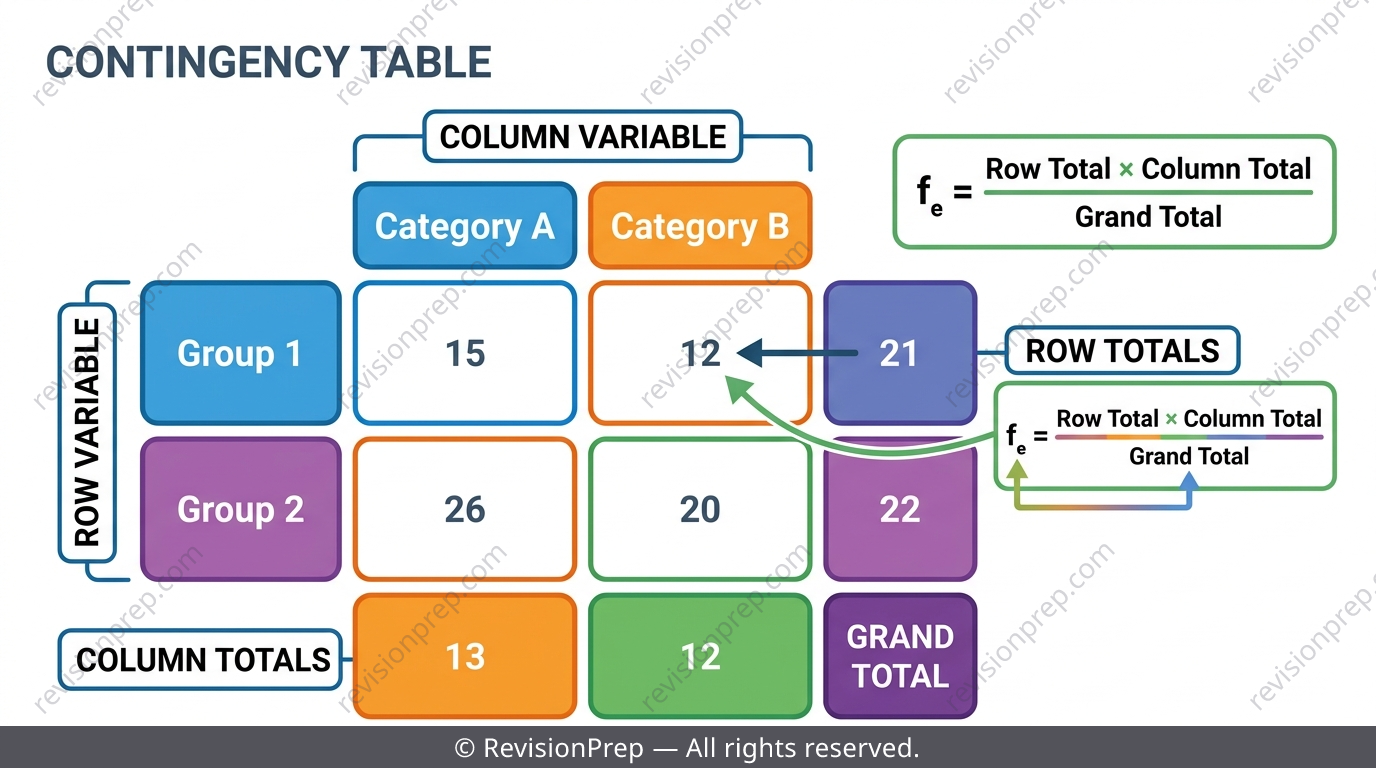
The chi-squared statistic compares observed frequencies to the expected frequencies you'd expect if two categorical variables were independent. Degrees of freedom for an contingency table are , and the conclusion should be written in terms of independence or association — never 'equality'.
Exam tip
Total the rows and columns first, build every from those totals, then recount and before applying .
Common mistake
Assuming by habit for every table instead of recounting rows and columns — a table gives , not 2.
Mini summary
Build from row/column totals, use , and conclude about independence, not equality.
Quick formula sheet
Practice questions
- State the difference between a population parameter and a sample statistic, giving one example of each.
- A dataset has and . Calculate the IQR and state the upper outlier fence.
- Write and for testing whether a machine's mean output has increased from a stated value of 500 units.
- A sample of 12 items gives , . Explain which formula you would use for a 95% confidence interval for and why.
- Explain why using instead of in a confidence interval calculation produces a narrower interval than it should.
- For a contingency table testing independence between two categorical variables, state the degrees of freedom.
- A population is known to have , but a student instead calculates a sample and uses it in a z-test. Explain the conceptual error and its effect on the conclusion.
- A 95% confidence interval for a claimed mean of 8000 is calculated as (7717, 7983). Explain why the claimed value lying outside this interval is not, on its own, a sufficient conclusion for a formal hypothesis test.
- Design a scenario where convenience sampling would bias the results of an inferential statistics test, and explain why no amount of correct calculation afterwards can fix this.
Frequently asked questions
What's the difference between a z-test and a t-test in IB Maths AI?+
Use a z-test only when the population standard deviation is explicitly given in the question. In almost every other case — where you estimate spread from sample data using — you use a t-test with degrees of freedom.
Why do I get the wrong confidence interval even when my arithmetic looks right?+
The most common cause is using the GDC's population-style standard deviation (, shown as ) instead of the unbiased sample standard deviation . Always check which one the question intends before you calculate.
How do I find degrees of freedom for a chi-squared test?+
Count the rows () and columns () of your contingency table and use . Recount for every new table — don't assume it's the same as a previous question.
Does the GDC do all the statistics calculations for me?+
Yes, your GDC computes regression coefficients, , , -values and inverse normal values instantly. The exam actually tests whether you set up the correct calculation and interpret the result in context.
Why does statistics and probability matter so much for my overall AI SL grade?+
It's the largest topic on the syllabus at roughly 27 teaching hours and appears in every Paper 1 and Paper 2, usually as one full 15-20 mark question plus smaller parts elsewhere — making it one of the highest-return topics to revise thoroughly.
How should I write a hypothesis test conclusion to get full marks?+
Always finish with a sentence that ties your statistical decision back to the scenario in the question — for example, referencing the lifetime of bulbs or the pH of lakes — rather than a generic 'reject ' statement.
Master every part of Statistics and Probability for IB Maths AI
Related articles