
Microeconomics
Master demand, supply, government intervention and market failure for IB DP Economics
Quick facts
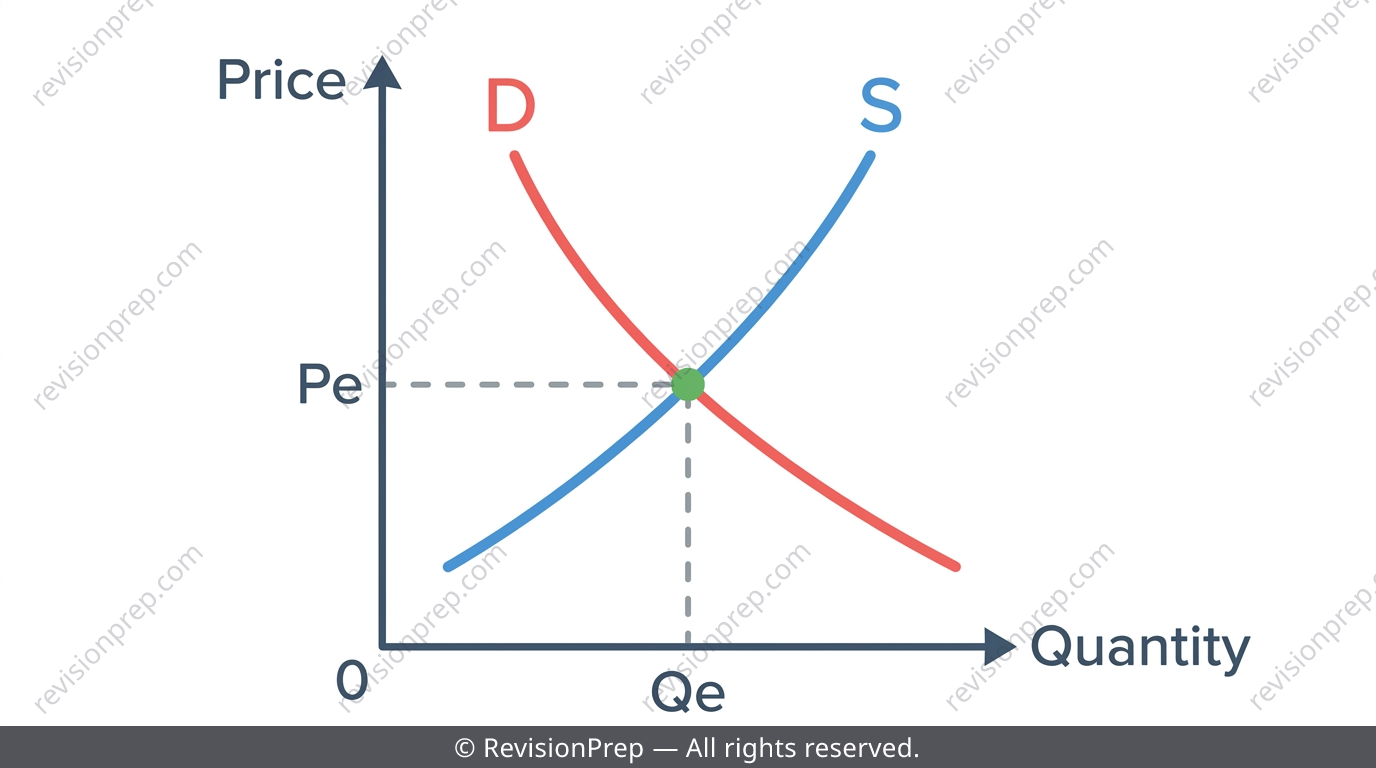
Microeconomics is the biggest unit in IB DP Economics, and it's the backbone of Paper 1, Paper 2, and Paper 3 for HL students. Everything starts with demand and supply meeting at a market equilibrium — then elasticities explain how sensitive that equilibrium is to change, and market failure explains why the free-market outcome isn't always the best one for society. Government intervention, from indirect taxes to price ceilings and buffer stock schemes, is the toolkit examiners love to test with diagram and data-response questions. This teaser pulls out the five ideas that show up most often in IB Economics exam-style questions: the law of demand, the market equilibrium skeleton, taxes and subsidies, price controls, and the HL-only exceptions — Veblen and Giffen goods. Get these solid and diagram-based questions stop being scary.
What you’ll be able to do
The Law of Demand: Movements vs Shifts
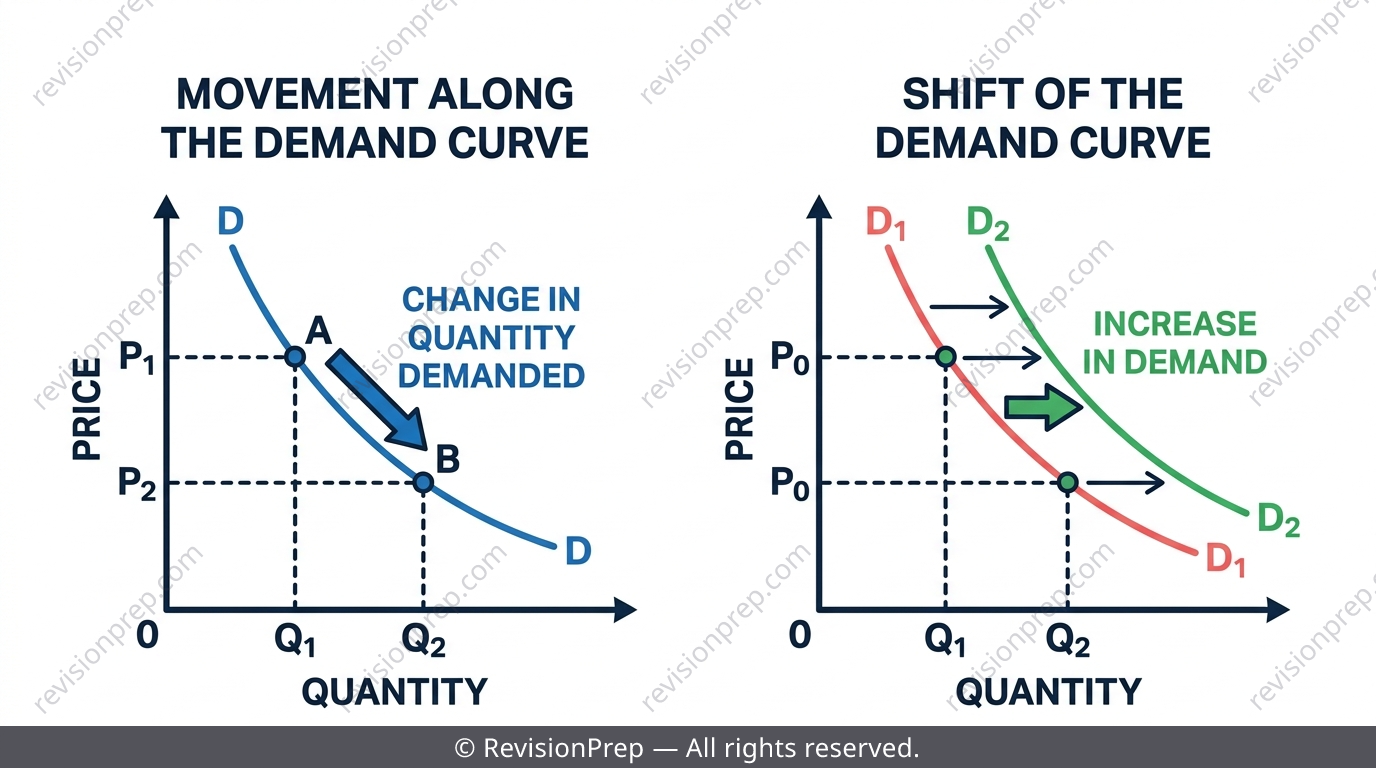
The law of demand says that, ceteris paribus, quantity demanded falls as price rises — giving demand its downward slope. This happens because of the substitution effect (a pricier good makes substitutes look better) and the income effect (a price rise reduces real purchasing power), reinforced by diminishing marginal utility. The distinction examiners test relentlessly: a change in the good's own price moves you along the curve (quantity demanded), while a change in any other factor like income or tastes shifts the whole curve (demand).
Exam tip
Always ask: did the good's own price change? If yes, write 'quantity demanded' and describe a movement along the curve. If no, write 'demand' and describe a shift.
Common mistake
Writing 'demand increased' when only quantity demanded changed due to a price movement, or vice versa.
Mini summary
Own-price change = movement along the curve; non-price change = shift of the curve.
Market Equilibrium: The Skeleton of the Whole Unit
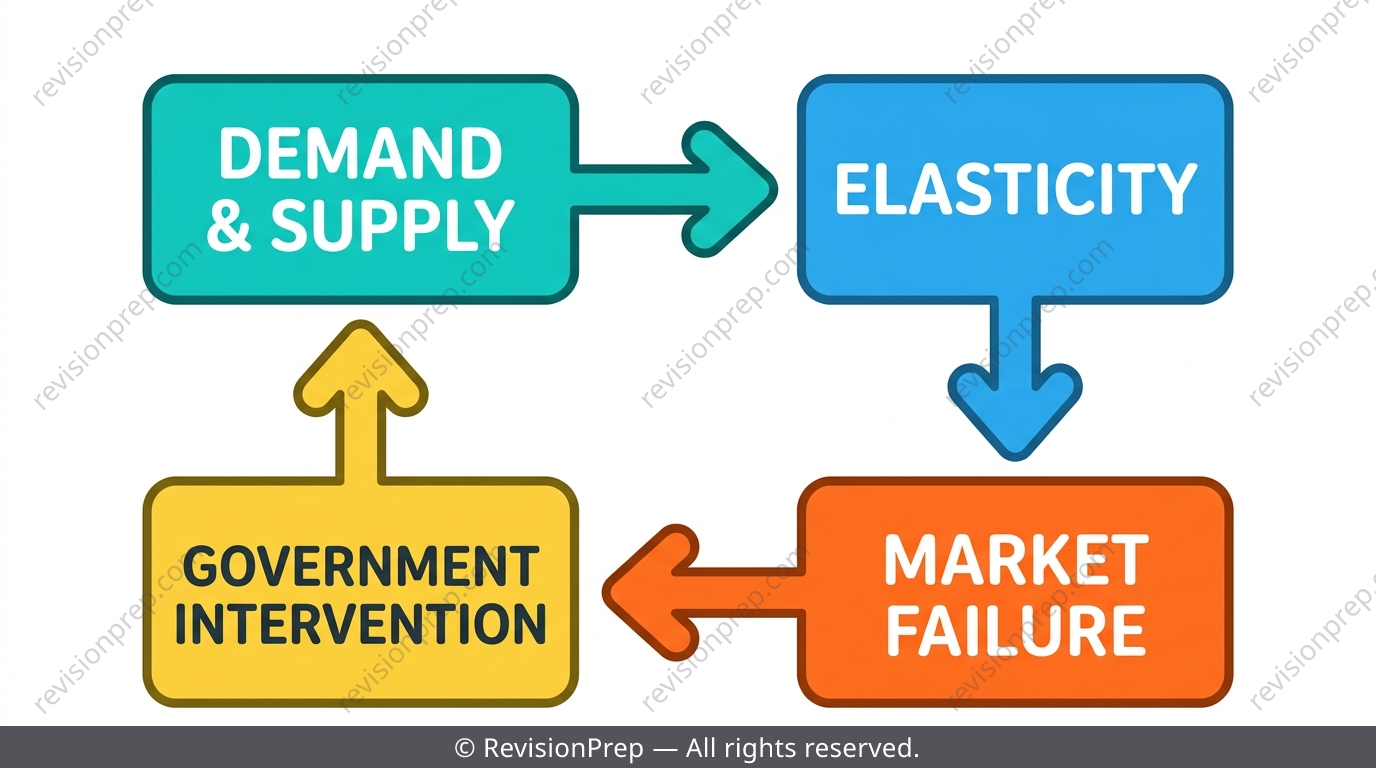
Demand and supply together determine a market's equilibrium price and quantity, and elasticities tell you how sensitive that equilibrium is to change. Market failure — externalities, missing public goods, overused common pool resources — is the reason the free-market equilibrium isn't always the socially efficient one, which sets up the whole government-intervention topic. Every diagram question is essentially a mini-essay: label both axes (Price/Quantity), name every curve, and mark both the old and new equilibrium clearly.
Exam tip
Command terms drive marks more than raw content — 'explain' wants a mechanism, 'evaluate' wants a judgement backed by a reason.
Mini summary
Equilibrium is the foundation; elasticity and market failure explain why and how it shifts or fails society.
Indirect Taxes & Subsidies: Shifting Supply
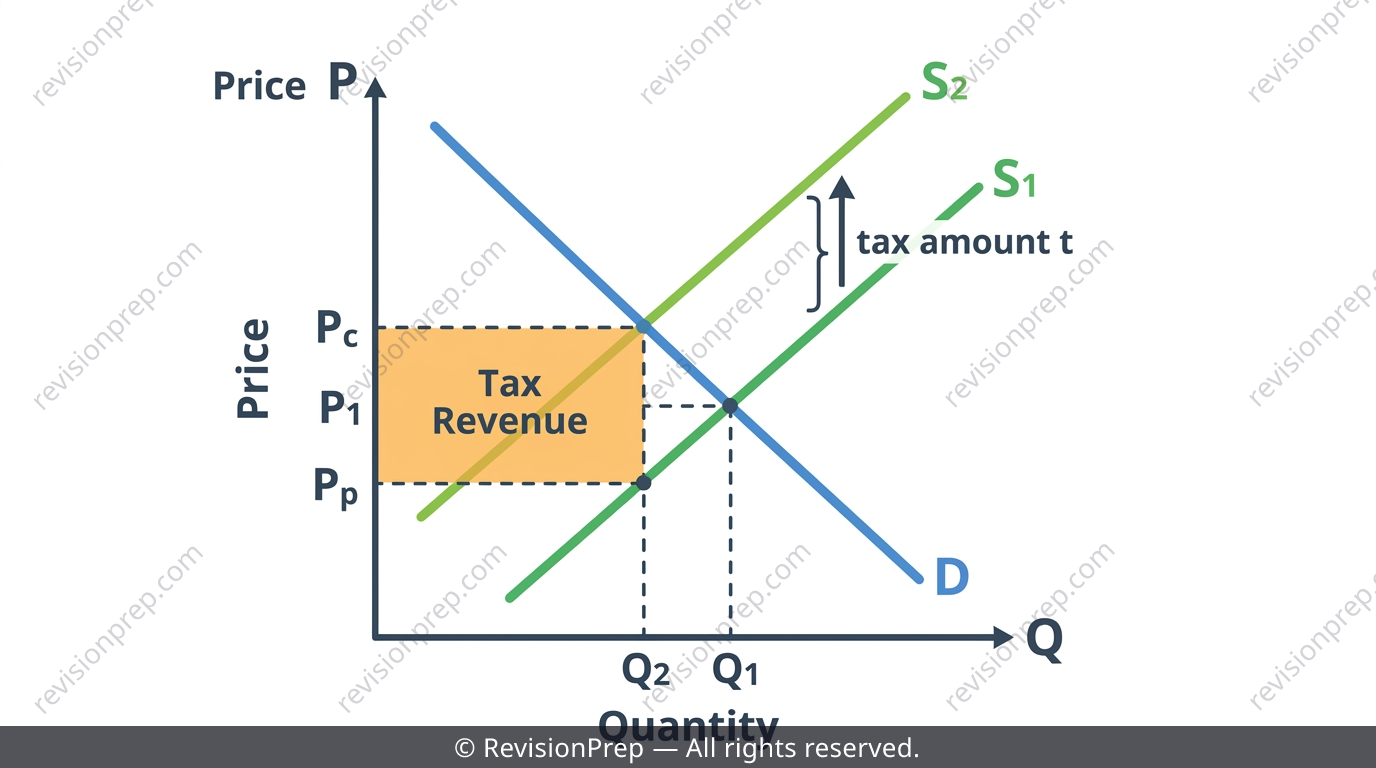
Taxes and subsidies change the cost of production per unit, so they always shift the SUPPLY curve — never demand. A specific tax is a fixed sum per unit (e.g. $2/litre), shown as a parallel shift of supply upward by the exact amount of the tax; an ad valorem tax is a percentage of price, shown as a pivoted shift that grows larger in absolute terms as price rises. A subsidy is a per-unit payment to producers that shifts supply to the right, lowering the market price.
| Feature | Specific tax | Ad valorem tax |
|---|---|---|
| How it's charged | Fixed amount per unit | Percentage of price |
| Supply curve shift | Parallel shift | Pivoted shift |
| Effect as price rises | Constant gap | Gap grows |
Exam tip
Taxes and subsidies change production costs → shift supply. Never draw them as demand shifts.
Common mistake
Drawing an indirect tax as a shift of the demand curve instead of supply.
Mini summary
Specific tax = parallel supply shift; ad valorem tax = pivoted supply shift; subsidies shift supply right.
Price Ceilings, Price Floors & Buffer Stocks
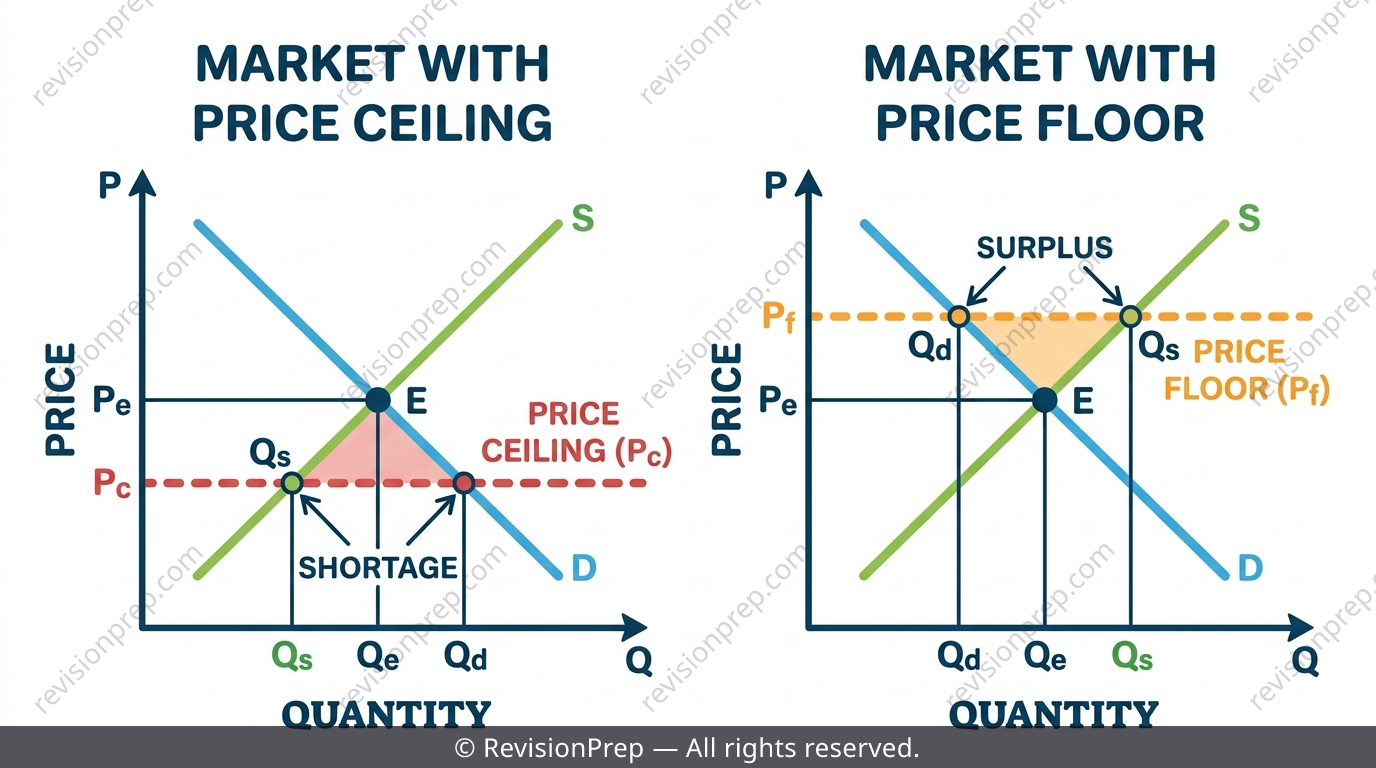
A price ceiling is a maximum legal price set below equilibrium to make a good more affordable, creating a persistent shortage if enforced. A price floor is a minimum legal price set above equilibrium to guarantee producers income, creating a persistent surplus if binding. Unlike taxes, price controls don't shift any curve — they simply cut the diagram with a fixed horizontal price line. A buffer stock scheme is a government commitment to buy up surplus at a price floor and release it when prices rise, used to stabilise commodity prices.
| Feature | Price ceiling | Price floor |
|---|---|---|
| Position vs equilibrium | Below Pe | Above Pe |
| Market effect | Shortage | Surplus |
| Common goal | Affordability | Guaranteed producer income |
Exam tip
Always check the control price is actually 'binding' — on the wrong side of Pe — before calculating any shortage or surplus.
Common mistake
Calculating a shortage using the original equilibrium quantity instead of the new quantity demanded at the ceiling price.
Mini summary
Ceilings and floors are horizontal price lines, not curve shifts — a binding ceiling causes shortage, a binding floor causes surplus.
HL Extension: Veblen & Giffen Goods
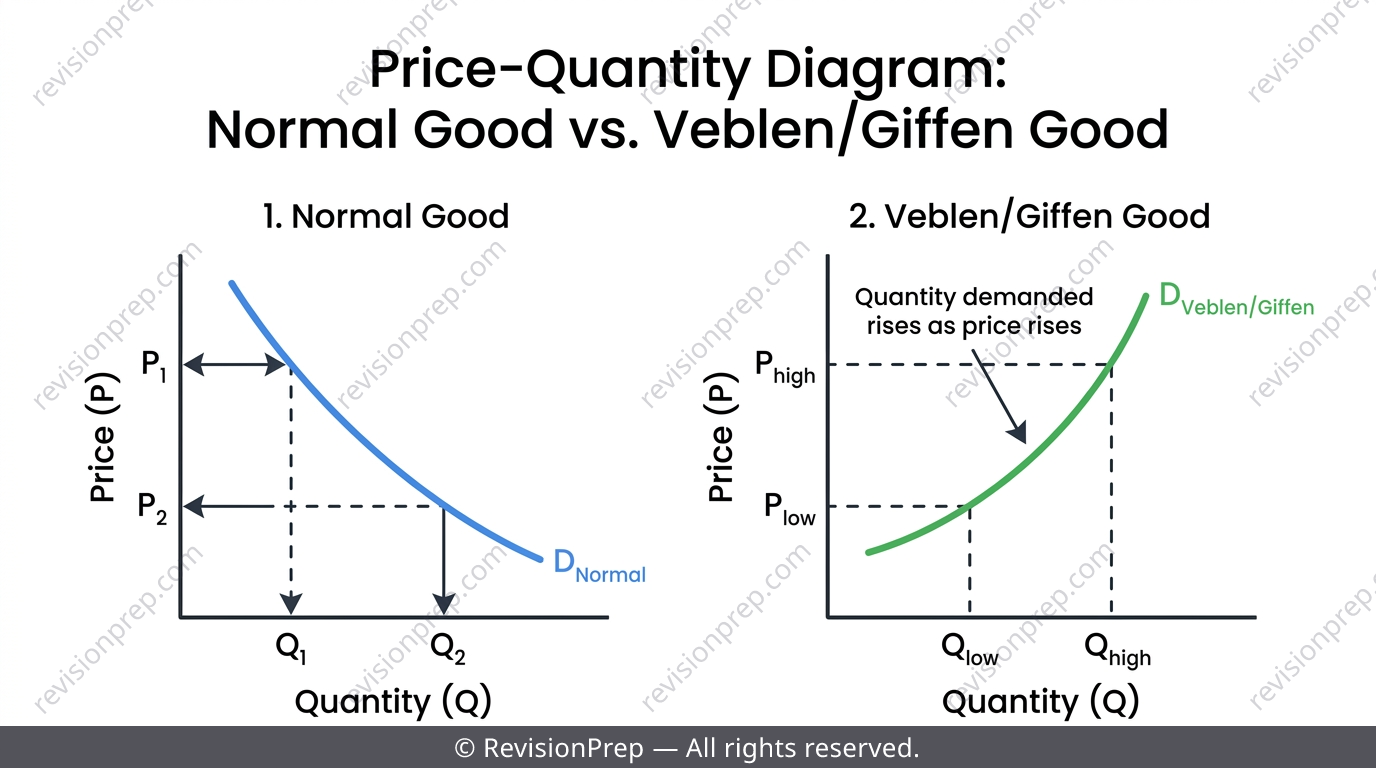
These two exceptions to the law of demand are HL only — not assessable at SL. Veblen goods are status or luxury goods (designer handbags, sports cars) where a higher price signals higher status, so quantity demanded can actually rise as price rises. Giffen goods are extreme inferior staple foods where the income effect of a price rise dominates the substitution effect, so consumers buy more of the staple because they can no longer afford the better alternative.
Common mistake
Applying Veblen or Giffen good reasoning to an SL question — these are HL-only content.
Mini summary
Veblen = status drives demand up with price; Giffen = income effect overwhelms substitution effect for inferior staples.
Quick formula sheet
Practice questions
- Define 'law of demand' and state what causes a movement along the demand curve.
- State the difference between a price ceiling and a price floor.
- Define 'specific tax' and give an example.
- Explain why a subsidy shifts the supply curve rather than the demand curve.
- Using a diagram, explain the effect of an ad valorem tax on equilibrium price and quantity.
- A price ceiling of $800 is imposed where equilibrium rent was $1,200 (Qe = 10,000). At $800, quantity supplied falls to 6,000 and quantity demanded rises to 13,000. Calculate the shortage.
- A government sets a minimum price of $50/tonne for wheat (equilibrium $35/tonne, 10 million tonnes traded). At $50, supply rises to 14 million tonnes and demand falls to 8 million tonnes, and the government buys all the surplus. Calculate the cost to the government.
- Evaluate whether a specific tax is an effective policy to reduce pollution from a good with relatively inelastic demand.
- Explain, using the concepts of substitution and income effects, why a Giffen good can have an upward-sloping demand curve.
Frequently asked questions
What's the difference between demand and quantity demanded?+
Quantity demanded changes because of the good's own price (a movement along the curve). Demand changes because of a non-price factor like income or tastes (a shift of the whole curve).
Why do taxes and subsidies shift supply instead of demand?+
Taxes and subsidies change the cost of production per unit for producers, not consumers' willingness to pay, so they are always drawn as shifts of the supply curve.
How do I know if a price ceiling or floor is binding?+
Check that the control price sits on the 'wrong' side of the free-market equilibrium — a ceiling must be below Pe and a floor must be above Pe, otherwise it has no effect on the market.
Are Veblen and Giffen goods tested at SL?+
No, these are HL-only content and are not assessable for Standard Level Economics students.
What's the difference between a specific tax and an ad valorem tax on a diagram?+
A specific tax shifts supply up by a fixed parallel amount, while an ad valorem tax pivots supply so the gap between old and new supply grows larger as price rises.
What is a buffer stock scheme used for?+
It's a government commitment to buy surplus output at a price floor and release stock when prices rise, used to stabilise commodity prices like agricultural goods.
Ready to master IB DP Microeconomics?
Related articles