
Probability
Sample spaces, combined events, and the probability formula — the MYP 1 essentials in one place.
Quick facts
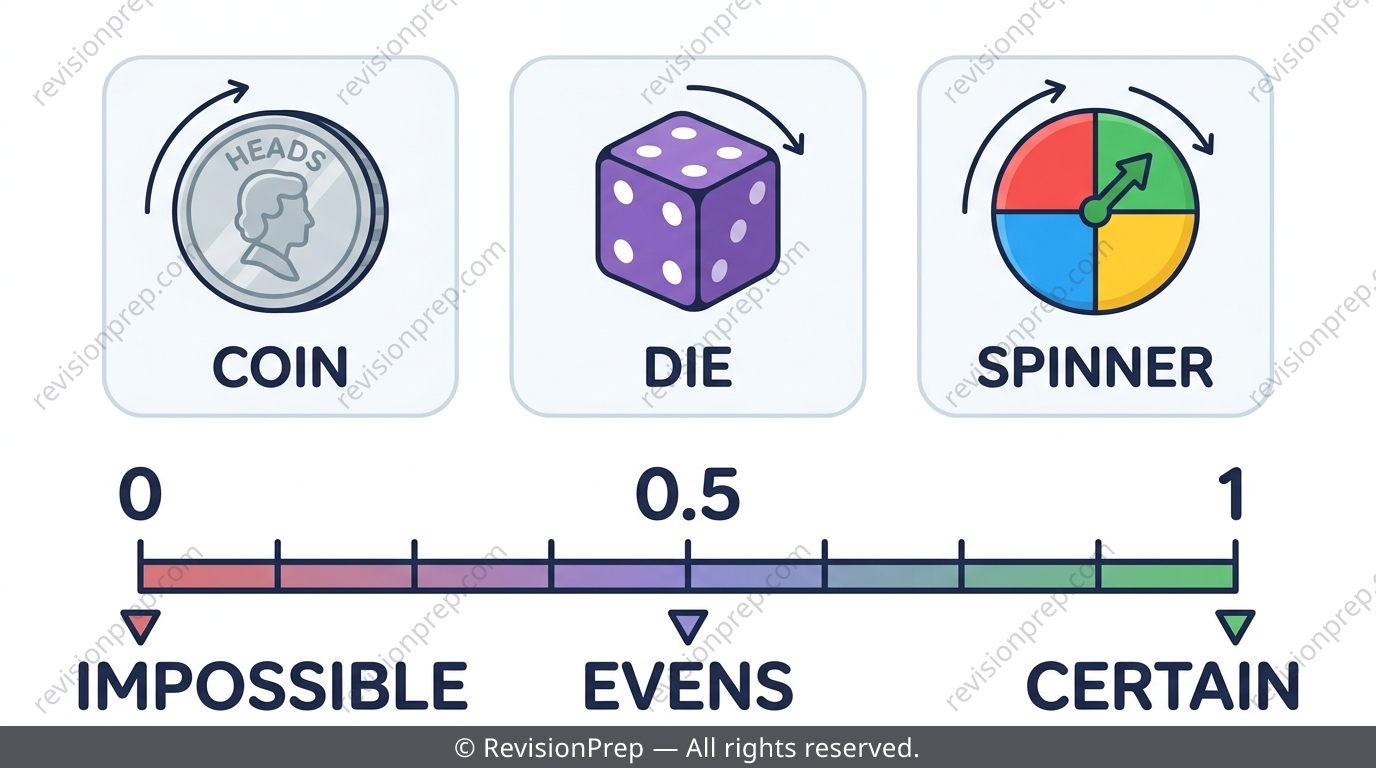
Probability in MYP 1 maths is about three skills examiners love to blend: counting outcomes correctly, turning that count into a fraction, and explaining what the answer actually means. Every question builds on the same idea — favourable outcomes over total outcomes — whether it's a single die roll, a coin-and-spinner combined event, or reading a Venn diagram of students who play football and basketball. This teaser walks through the probability scale, single vs combined events, the core probability formula, and an introduction to tree and Venn diagrams, flagging the exact mistakes that lose marks along the way (like adding outcomes instead of multiplying, or forgetting the 'neither' region). For the full breakdown with worked examples, definitions and practice sets, the complete revision note is linked at the end.
What you’ll be able to do
The Probability Scale: From Impossible to Certain
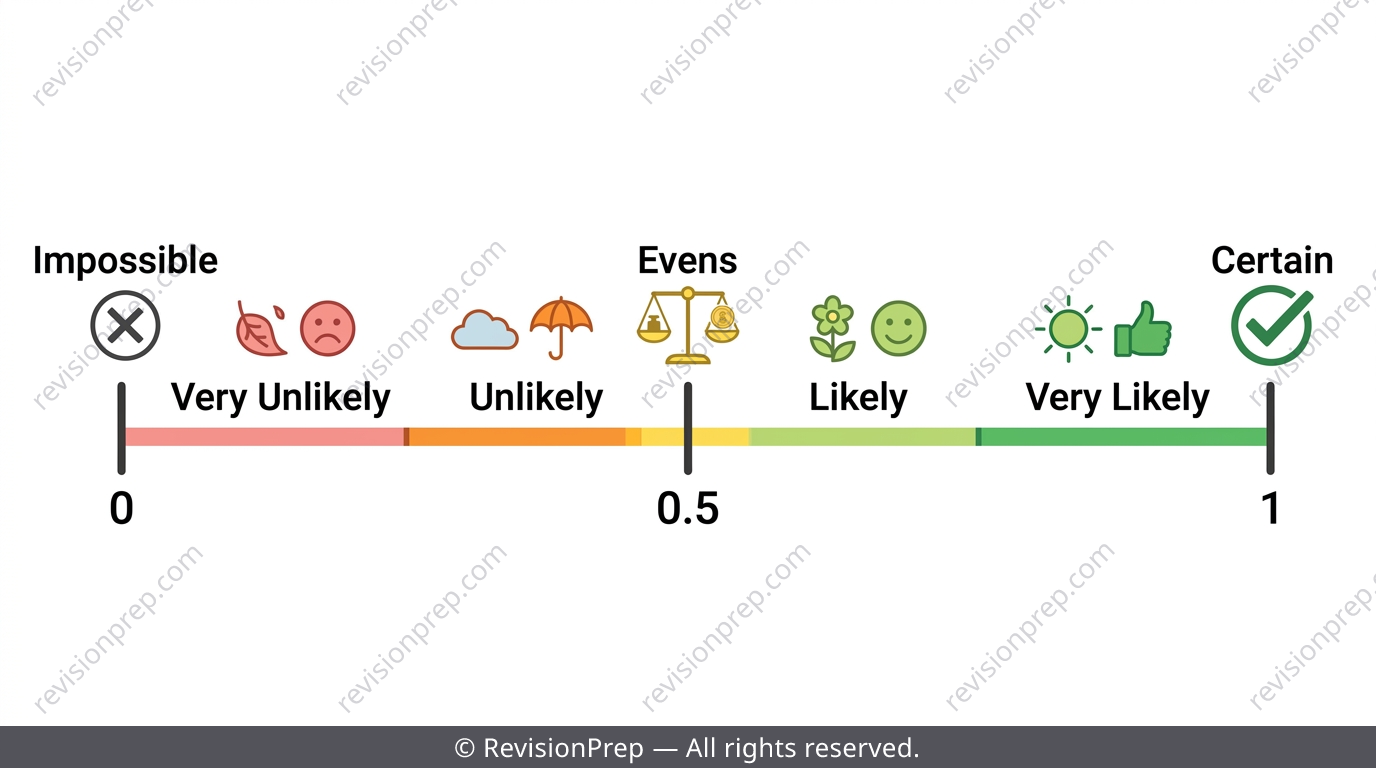
Probability measures how likely something is, and it always lands somewhere between 0 and 1 (or 0% to 100%). An event that can never happen is 0 ('impossible'), one that will definitely happen is 1 ('certain'), and exactly in the middle at 0.5 sits 'evens'. Fractions, decimals and percentages are just three ways of writing the same value, and real-world predictions like '30% chance of rain' are estimates based on past data, not guarantees.
Exam tip
Match the correct vocabulary word (unlikely, evens, likely, etc.) to the value examiners give you — don't just leave the number unexplained.
Mini summary
Probability always sits between 0 and 1, and can be written as a fraction, decimal or percentage.
Single Events, Sample Spaces and Combined Events
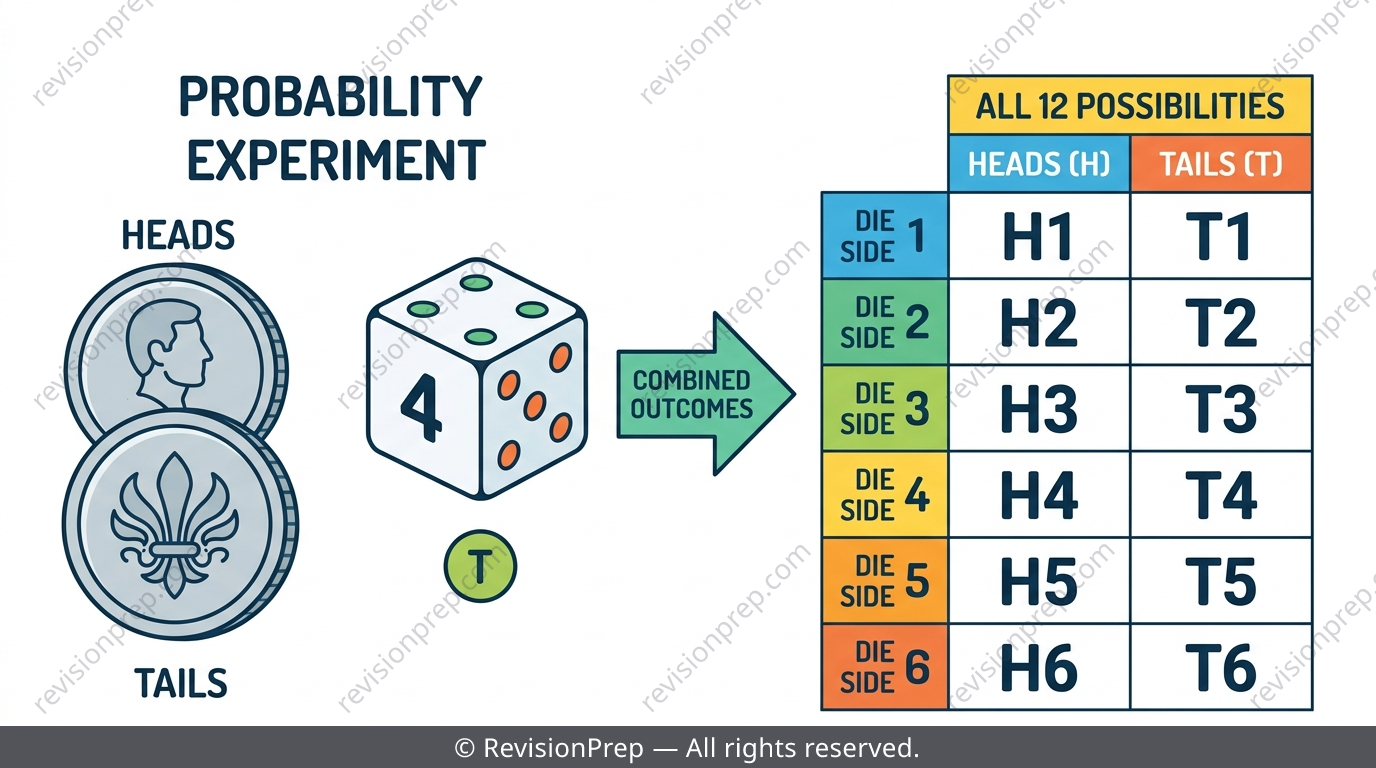
A trial is one go at something, and the sample space is the complete list of every outcome it could produce — rolling one die gives the sample space {1,2,3,4,5,6}. A combined event links two trials together, like tossing a coin AND rolling a die, and the sample space grows by multiplying: outcomes. The key trap is confusing the full sample space with the event you actually care about, such as 'rolling a prime number' being just 3 of the 6 outcomes.
Exam tip
List outcomes systematically (H1, H2, H3... T1, T2, T3...) so nothing gets missed under time pressure.
Common mistake
Adding the outcomes of a combined event (2+6=8) instead of multiplying them (2×6=12).
Mini summary
Combined events multiply the number of outcomes from each stage — never add them.
The Probability Formula with Dice, Coins and Spinners
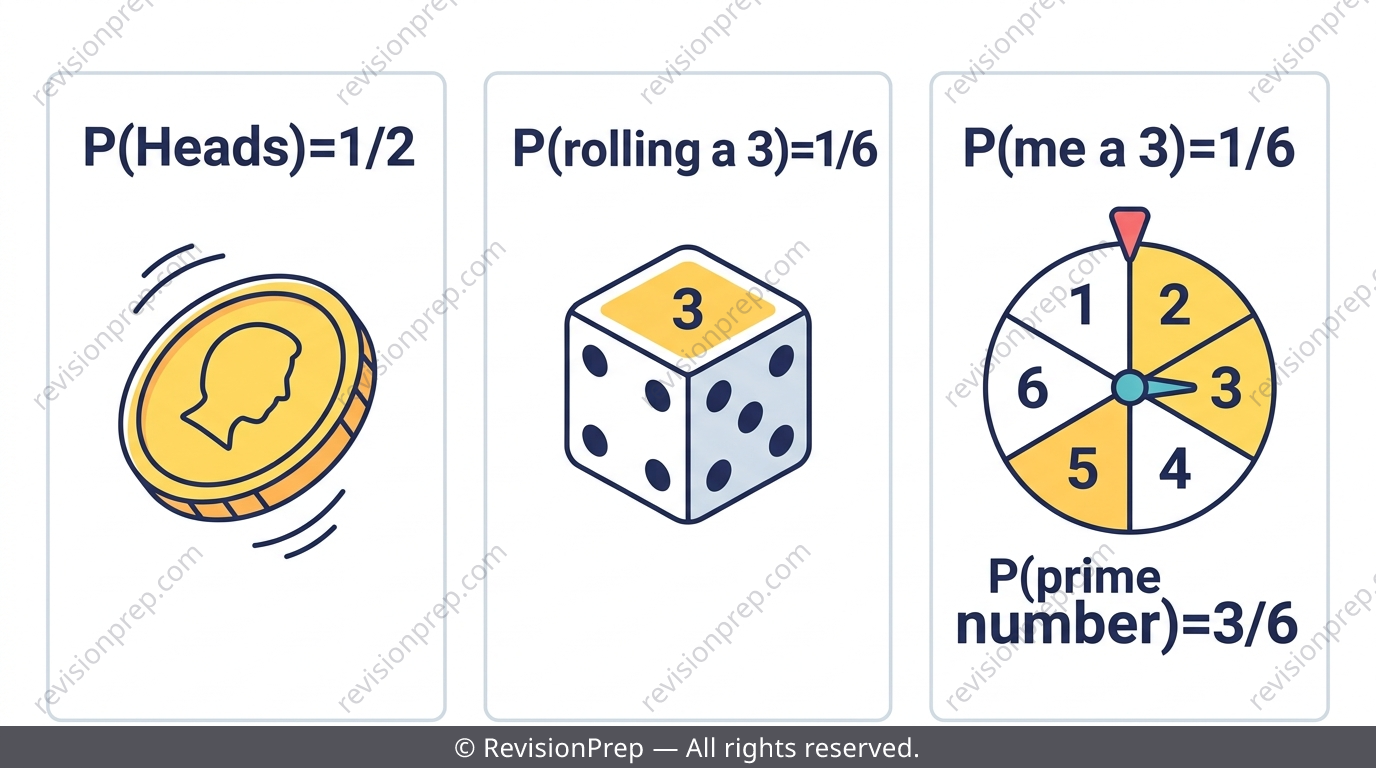
Dice, coins and spinners are used constantly in this topic because every face or section is equally likely, which is exactly what the formula requires. A fair coin gives , a fair die gives for any single number, and a spinner with equal sections gives per section. When colours or numbers repeat across sections, count how many sections satisfy the event — not how many distinct labels there are.
| Tool | Total outcomes | Example event | Probability |
|---|---|---|---|
| Fair coin | 2 | Landing on Heads | 1/2 |
| Fair 6-sided die | 6 | Rolling a prime number | 3/6 = 1/2 |
| 6-section spinner | 6 | Landing on a specific number | 1/6 |
Exam tip
When comparing 'which gives a better chance', always convert to fractions with the same denominator before comparing raw counts.
Common mistake
Comparing raw counts of favourable outcomes (e.g. 3 vs 2) between two setups with different totals, instead of comparing simplified fractions.
Mini summary
The formula favourable ÷ total only works when outcomes are equally likely — always simplify before comparing.
Tree Diagrams: Counting Combined Event Outcomes
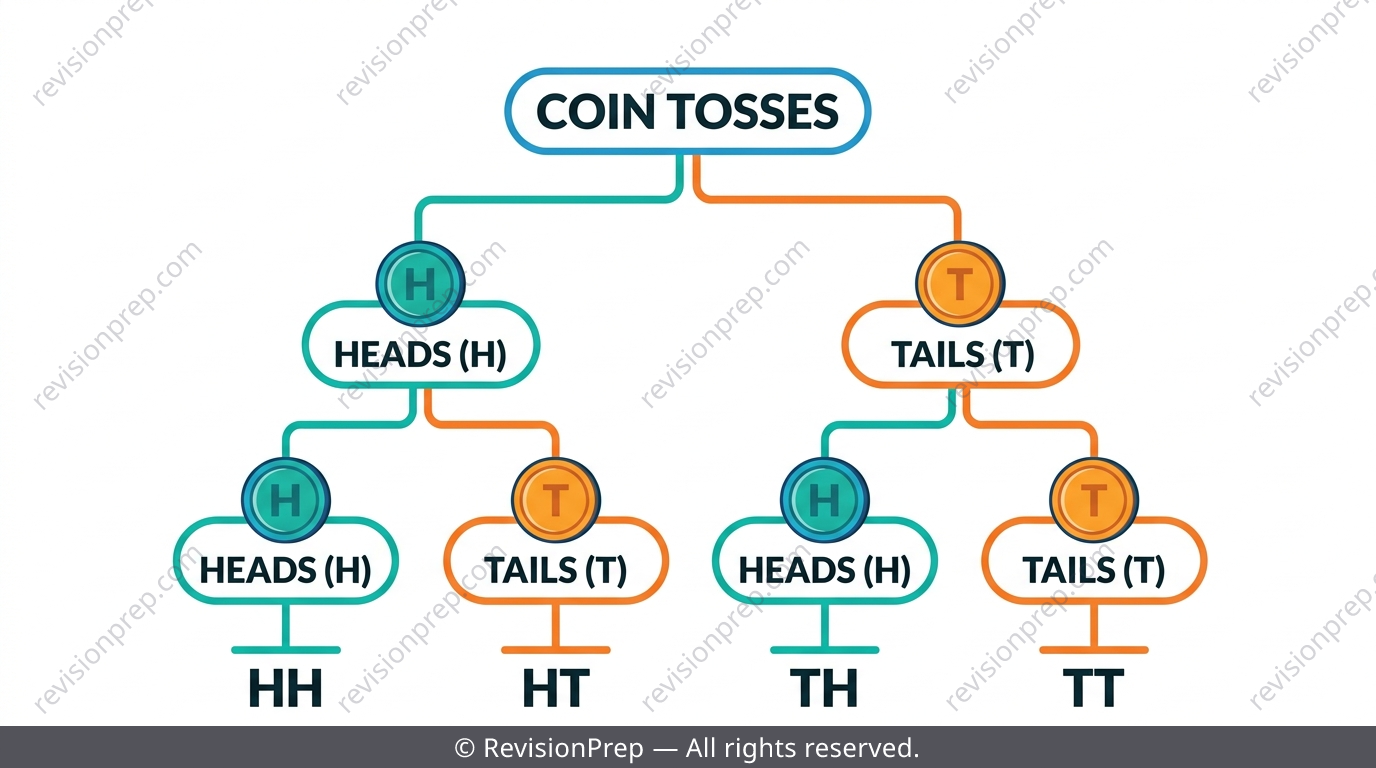
A tree diagram lists every outcome of a combined event stage by stage, with each branch showing one possible result at that stage. Following a complete path from start to finish gives one outcome, and the total number of end-branches equals the product of the branches at each stage — the same multiplication rule as combined events. This makes tree diagrams the natural next step after learning to count sample spaces.
Mini summary
Total outcomes in a tree diagram equal the product of the branches at each stage.
Venn Diagrams: Sorting Into Overlapping Categories
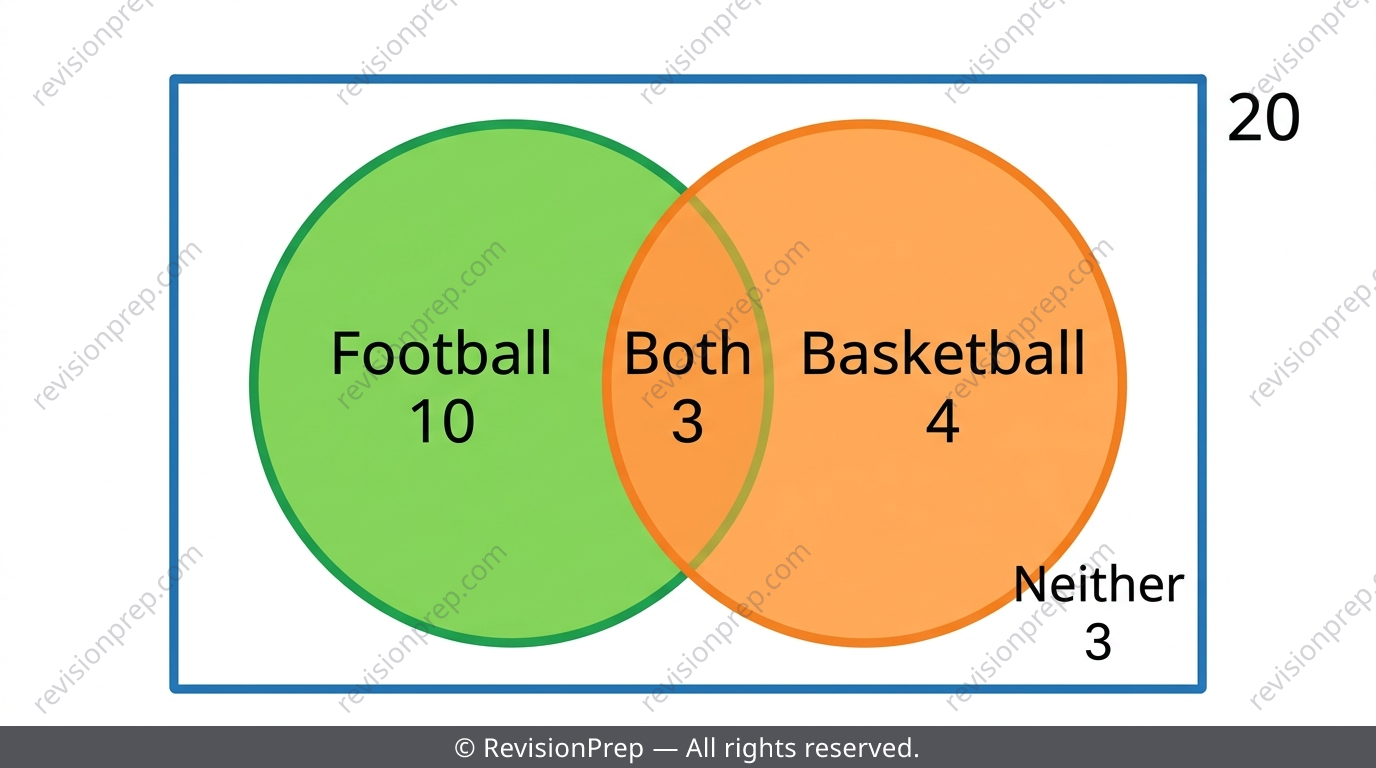
A Venn diagram sorts individual items into two overlapping circles, with the overlap meaning 'both' and the space outside both circles (but inside the rectangle) meaning 'neither'. Probability from a Venn diagram is simply the count in the region you want divided by the total in the whole rectangle. The most repeated error at this level is forgetting to include the 'both' region or the 'neither' region, which makes the denominator too small.
Exam tip
Before calculating, add up all four regions (only A, only B, both, neither) and check they match the total group size.
Common mistake
Writing for 'plays at least one sport' and forgetting to add the 'both' region, or forgetting 'neither' exists at all.
Mini summary
Venn diagrams have four regions for two sets — always find the correct region(s) and the correct total before dividing.
Quick formula sheet
Practice questions
- A fair coin is tossed once. What is P(Tails)?
- Write the sample space for rolling one six-sided die.
- On the probability scale, what word describes an event with probability 1?
- A coin is tossed and a die is rolled at the same time. How many outcomes are in the sample space?
- A spinner has 6 equal sections numbered 1-6. What is P(landing on a prime number)?
- Draw a simple two-stage tree diagram for tossing a coin twice and list all outcomes.
- Spinner A has 6 equal sections (2 are prime) and Spinner B has 4 equal sections (2 are prime). Which spinner gives a better chance of landing on a prime number, and why?
- In a class of 20, a Venn diagram shows 10 play only Football, 4 play only Basketball, 3 play both, and 3 play neither. Find the probability a randomly chosen student plays at least one sport.
- Explain why treating a combined event's total outcomes as an addition instead of a multiplication would give a wrong sample space size, using a coin-and-die example.
Frequently asked questions
What is the basic probability formula used in MYP 1?+
P(A) = favourable outcomes ÷ total possible outcomes, which only works correctly when every outcome is equally likely, like on a fair coin, die or spinner.
What's the difference between a sample space and an event?+
The sample space is every possible outcome of a trial (e.g. all 6 faces of a die), while an event is just the specific outcomes you're interested in, like 'rolling a prime number'.
Why do combined events multiply instead of add?+
Each outcome from the first trial can pair with every outcome from the second trial, so the total number of combinations is the product of the two counts, not their sum.
How do I find a probability from a Venn diagram?+
Add up the count in the region(s) you need, divide by the total number in the whole rectangle, and always check all four regions (only A, only B, both, neither) sum to the stated total first.
What does a probability of 0.5 mean?+
It means the event is 'evens' — exactly as likely to happen as not, sitting right in the middle of the 0 to 1 probability scale.
How many outcomes are there when tossing a coin and rolling a die together?+
12 outcomes, because there are 2 coin outcomes multiplied by 6 die outcomes (2 × 6 = 12), not 2 + 6.
Master Probability with the Full MYP 1 Revision Note
Related articles