
Probability and Outcomes
Master IB MYP 2 probability: theoretical vs experimental, combined events, and tree diagrams explained simply
Quick facts
Probability and Outcomes is one of the most reliable scoring topics in IB MYP 2 Mathematics, appearing again and again in unit tests and end-of-year exams under Criterion A and Criterion D. Every question — whether it's about dice, coins, spinners, or marbles — comes back to the same core idea: counting favourable outcomes against total outcomes. The real challenge in MYP 2 is moving beyond single events into combined events, where totals multiply rather than add, and learning to distinguish theoretical probability (what should happen) from experimental probability (what actually happened in trials). Examiners love slipping a wrong student claim into a question and asking you to judge it, so you need to explain your reasoning, not just state a fraction. This teaser walks through the five ideas that matter most, with the common traps examiners build in on purpose.
What you’ll be able to do
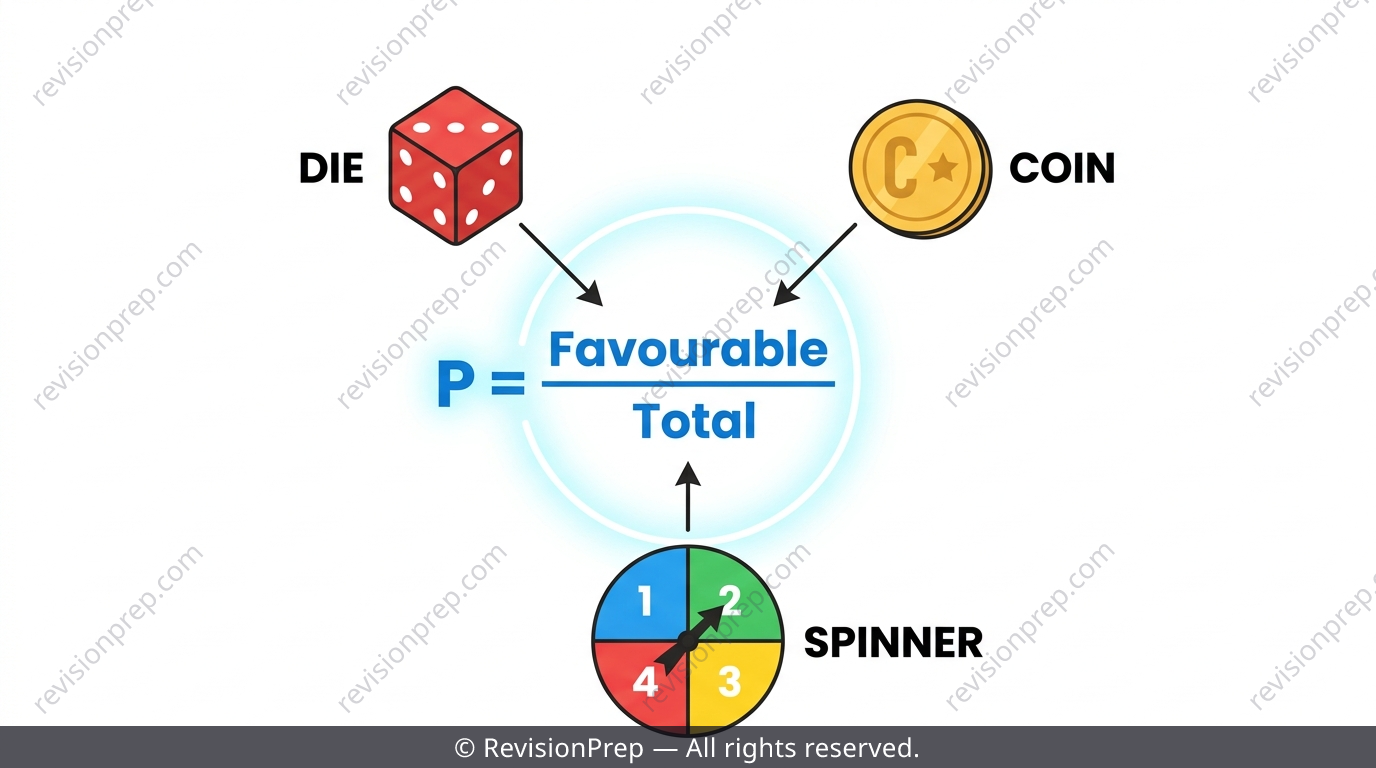
The Core Formula: P = F/T
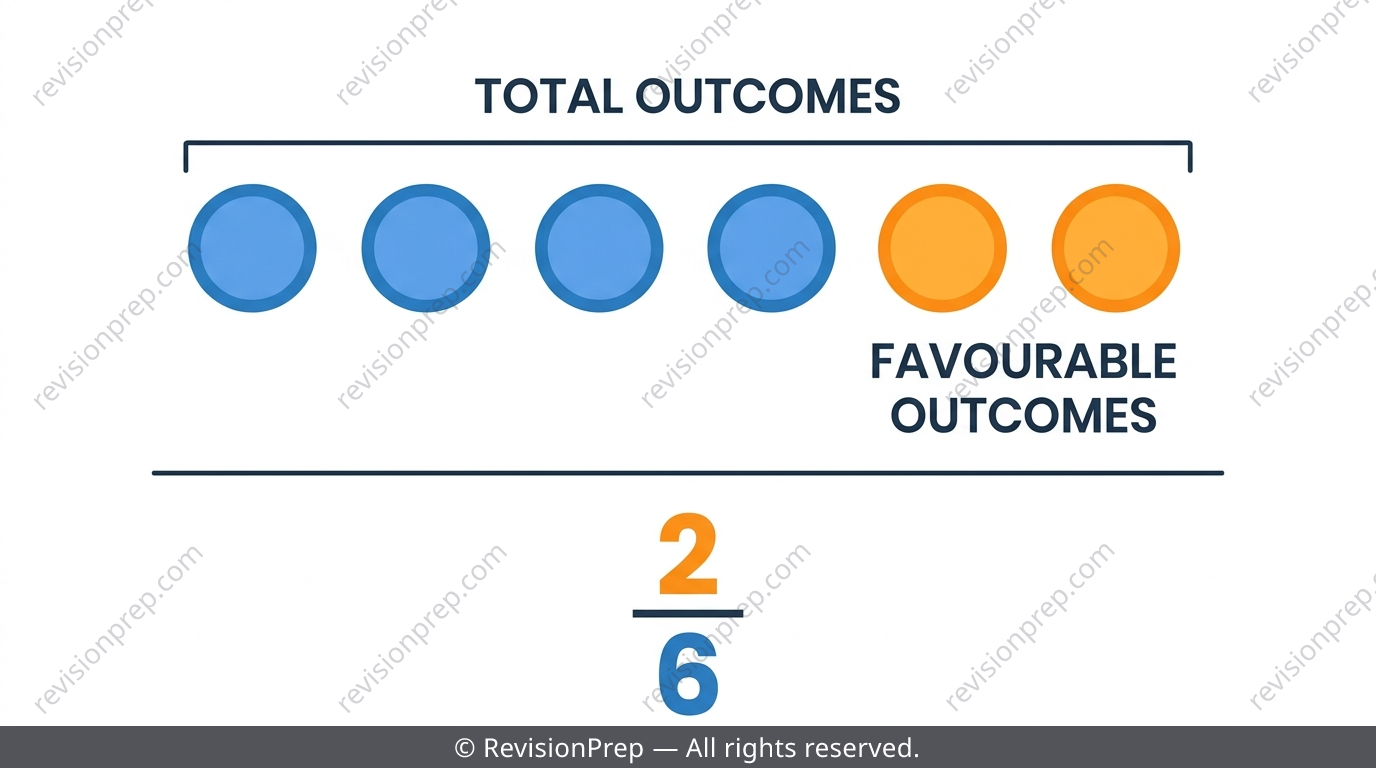
Every probability question in this topic reduces to one structure: count the favourable outcomes, count the total outcomes, and divide. Whether it's a die, coin, spinner, or bag of marbles, the formula never changes shape. What changes is how carefully you count , especially once events get combined.
Exam tip
Before calculating anything, write out what T actually represents in words — this catches most counting errors before they happen.
Mini summary
P = F/T is the backbone of every probability question — the skill is counting T correctly.
Theoretical vs Experimental Probability
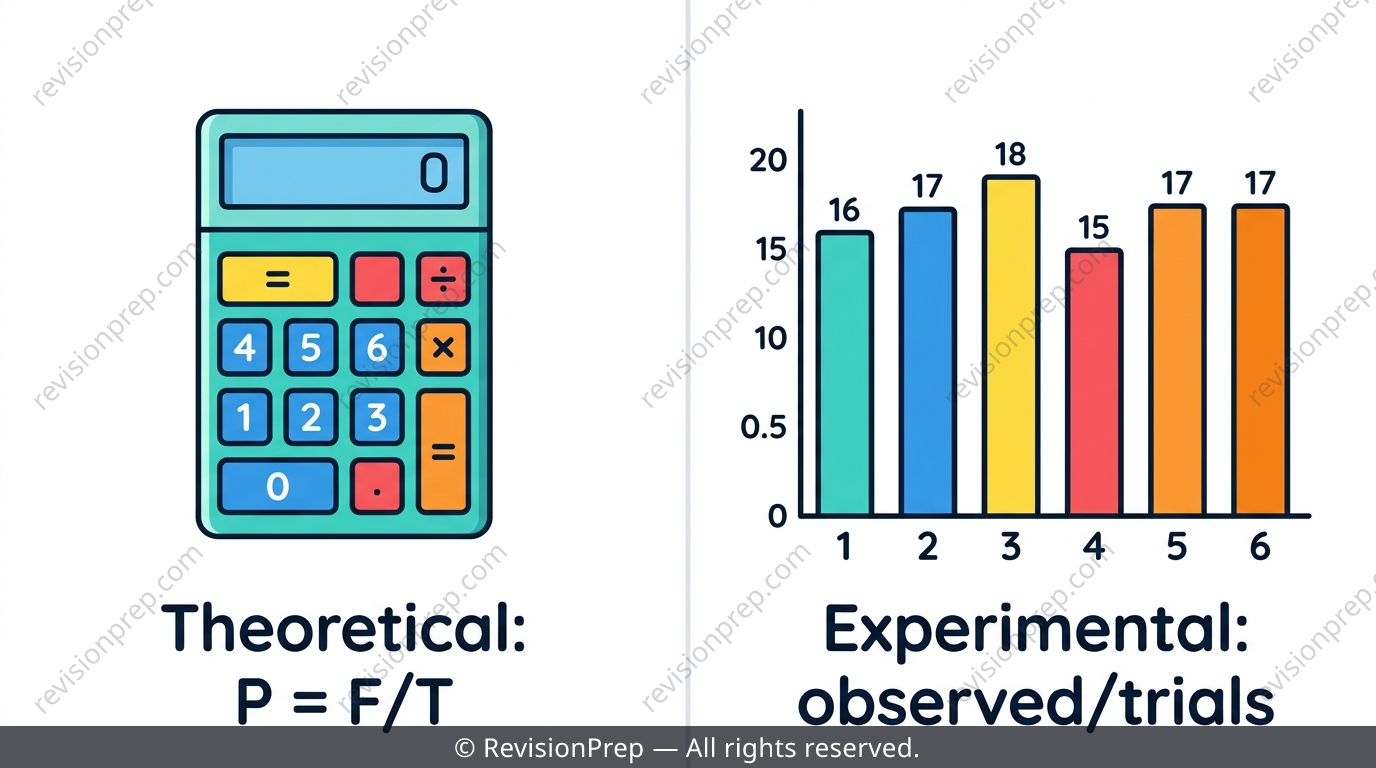
Theoretical probability is calculated purely from reasoning about equally likely outcomes — no trials needed. Experimental probability comes from actually running trials: observed successes divided by number of trials, calculated using as the prediction. These two rarely match exactly in small samples, and that's normal randomness, not a sign the die or coin is unfair.
Common mistake
Assuming an experimental result must exactly equal the theoretical prediction — small samples naturally vary; fairness only shows up over large numbers of trials.
Mini summary
Theoretical = calculated in advance; experimental = measured from real trials; they converge only as trials increase.
Single vs Combined Events
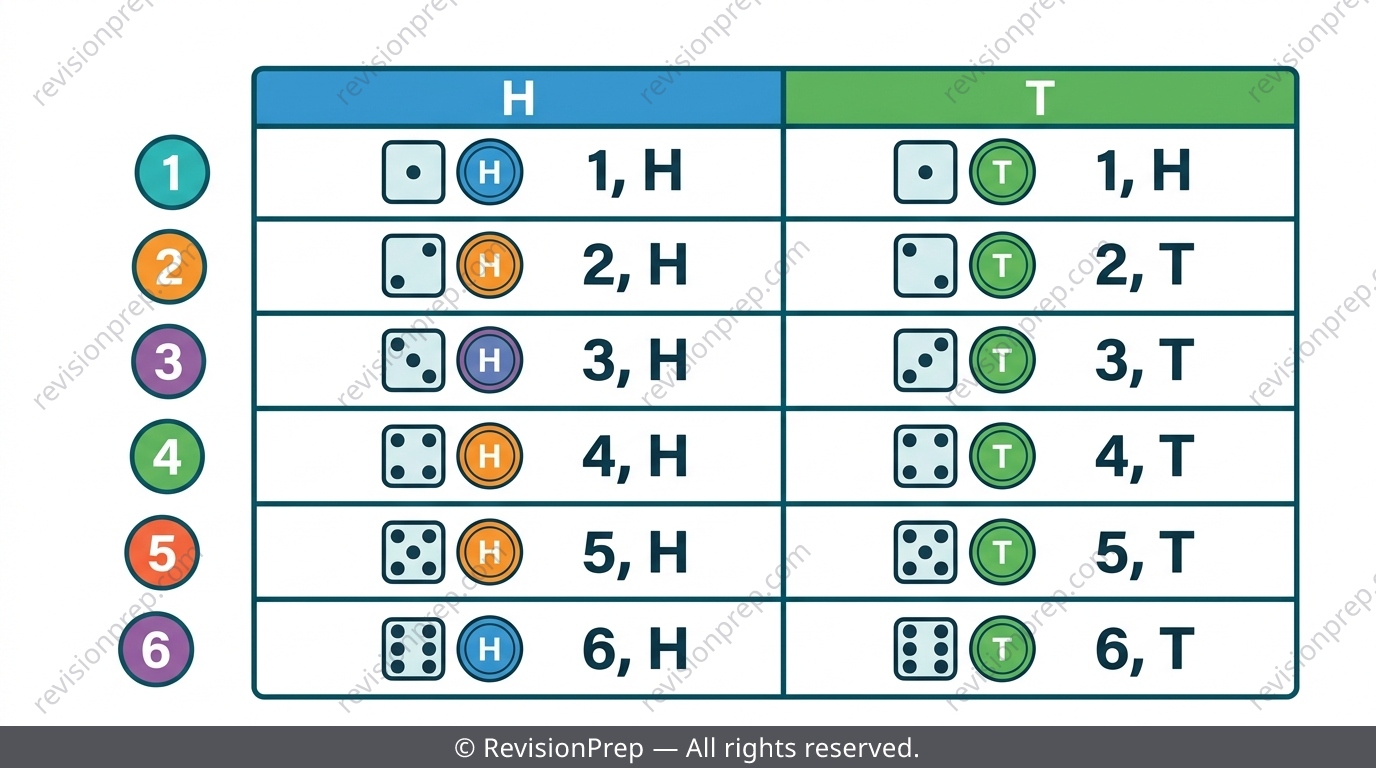
A single event uses one action, like rolling one die. A combined event links two or more actions, like a die AND a coin, and this is where totals multiply: . If the events are independent — one outcome has zero effect on the other — then .
Common mistake
Adding instead of multiplying when finding combined totals — a die and coin give 12 outcomes, not 8.
Mini summary
Combined events multiply totals and multiply probabilities — never add them.
Dice, Coins and Spinners: The 36-Outcome Trap
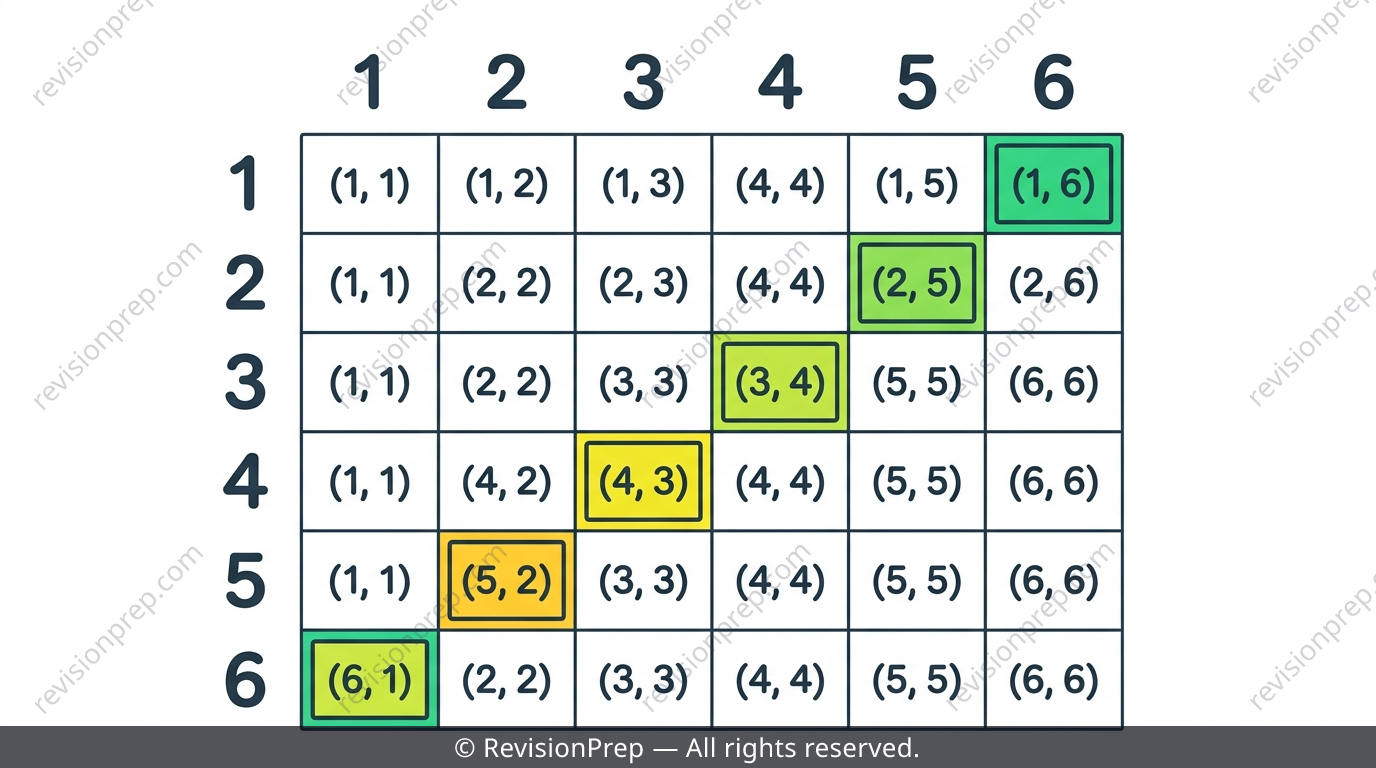
Two dice rolled together give total outcomes, because and count as two separate equally likely outcomes. A sum of 7 can be made six different ways: . The natural but wrong instinct is to count possible sums (2 to 12, giving 11) instead of outcome pairs (36) — sums are not equally likely, so 11 can never be the denominator.
Exam tip
When judging someone else's probability claim, redo the calculation yourself first, then write an explicit 'correct' or 'incorrect' verdict — a right calculation without a final verdict sentence often loses the last mark.
Mini summary
Two dice always give 36 equally likely outcomes — never 11, never 6.
Tree Diagrams and Venn Diagrams
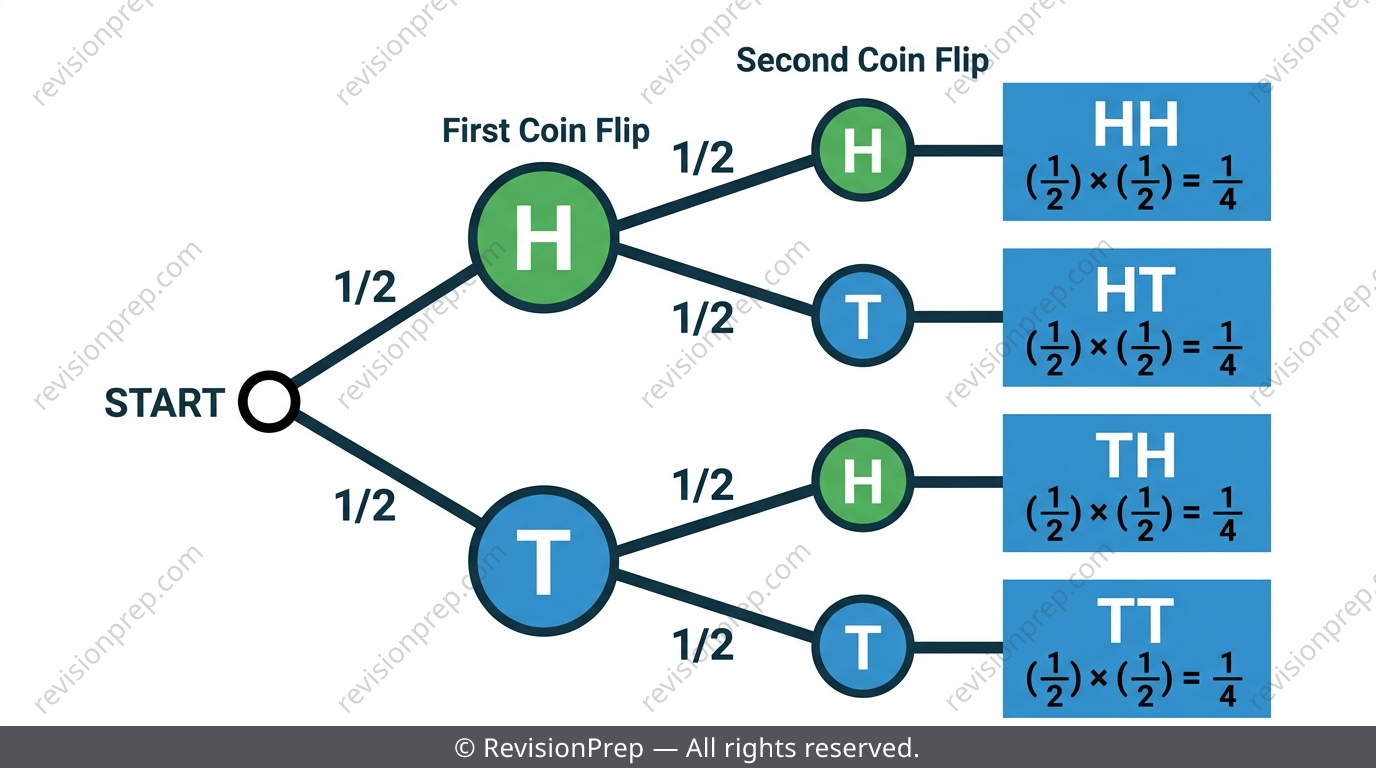
A tree diagram shows combined events as branching paths: multiply probabilities along one path, then add across separate complete paths when combining several results. A Venn diagram instead shows how two properties overlap within one sample space, useful for 'and', 'or', and 'not' style questions.
Exam tip
Remember the rule of thumb: along a branch — multiply; across separate paths — add.
Mini summary
Trees suit sequential combined events; Venn diagrams suit overlapping categories in one sample space.
Quick formula sheet
Practice questions
- A fair coin is flipped once. What is P(heads)?
- A spinner has 4 equal sections numbered 1-4. What is P(spinning a 3)?
- A bag has 5 red and 3 blue marbles. What is P(drawing red)?
- A die is rolled 20 times. Calculate the expected frequency of rolling a 5.
- A coin is flipped and a die is rolled together. Find the total number of combined outcomes and P(heads and a 6).
- List all outcome pairs for two dice that give a sum of 9, then state the total number of possible outcomes.
- A student claims a spinner with 4 sections gives P(sum of two spins = 5) equal to 1/4. Judge whether this claim is correct, showing your reasoning.
- In 30 rolls of a fair die, a 6 appears only twice instead of the expected 5. Explain whether this proves the die is unfair.
- Draw a tree diagram for flipping a coin twice, then use it to find P(exactly one head).
Frequently asked questions
What's the difference between theoretical and experimental probability?+
Theoretical probability is calculated from reasoning about equally likely outcomes before any trials happen. Experimental probability is measured from actual results of real trials, and it can change each time you repeat the experiment.
Why do total outcomes multiply instead of add for combined events?+
Because every outcome of the first action pairs with every outcome of the second action, forming a full grid of combinations — that's why , not .
Why are there 36 outcomes for two dice, not 11?+
Sums from 2 to 12 aren't equally likely, so counting 11 possible sums is wrong. Each die shows 1-6 independently, and since order matters, (1,2) and (2,1) are separate outcomes, giving equally likely outcomes.
Does an unexpected experimental result mean the die is unfair?+
Not necessarily. Small samples naturally vary from the expected value due to randomness. Fairness is only meaningfully tested over a large number of trials, not a single small session.
What does 'independent' mean in probability?+
Independent events are events where the outcome of one has zero effect on the probability of the other, like a die roll never influencing a coin flip. This is different from mutually exclusive events, which can't both happen at once.
When should I use a tree diagram versus a Venn diagram?+
Use a tree diagram for sequential or combined independent events, multiplying along each branch. Use a Venn diagram when classifying a single sample space by two overlapping properties, like 'and', 'or', or 'not' questions.
Get the Full IB MYP 2 Probability Revision Notes
Related articles