
Probability and Outcomes
The counting skills behind every dice, coin, spinner and tree diagram question in IB MYP 3
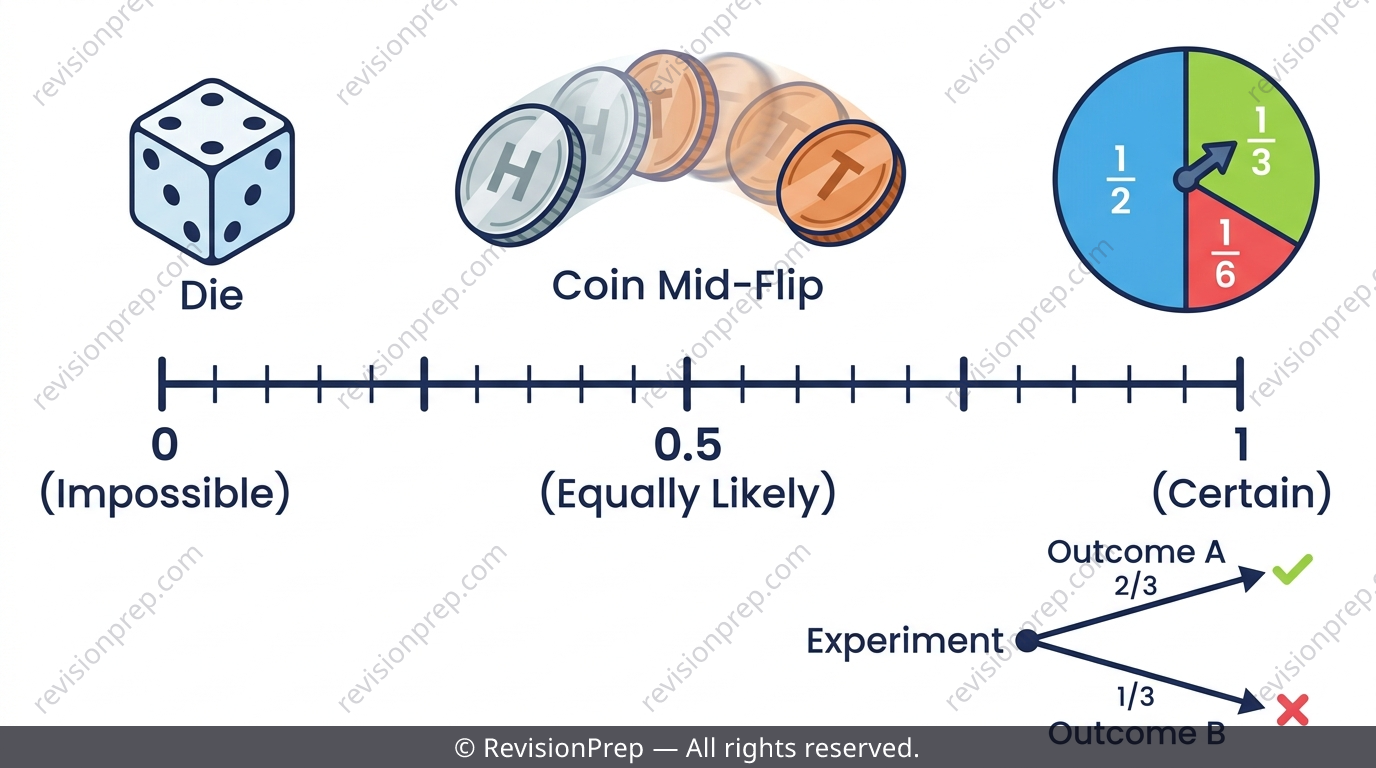
Quick facts
Every probability question in IB MYP 3 boils down to one of two skills: predicting an outcome by counting a sample space (theoretical probability), or measuring one from real trial data (experimental probability). Dice, coins, spinners, sample space grids and tree diagrams are just the settings where this counting happens. Once you can tell single events apart from combined events, and know when to add probabilities versus multiply them, most of the unit becomes routine. This teaser walks through the five ideas examiners test most — theoretical vs experimental probability, the AND/OR rules, equally likely outcomes on dice/coins/spinners, expected frequency, and reading tree diagrams — with the exact traps students fall into. For the full worked examples, formula derivations and MYP Criterion A/D investigation guidance, the complete revision note is linked below.
What you’ll be able to do
Theoretical vs Experimental Probability
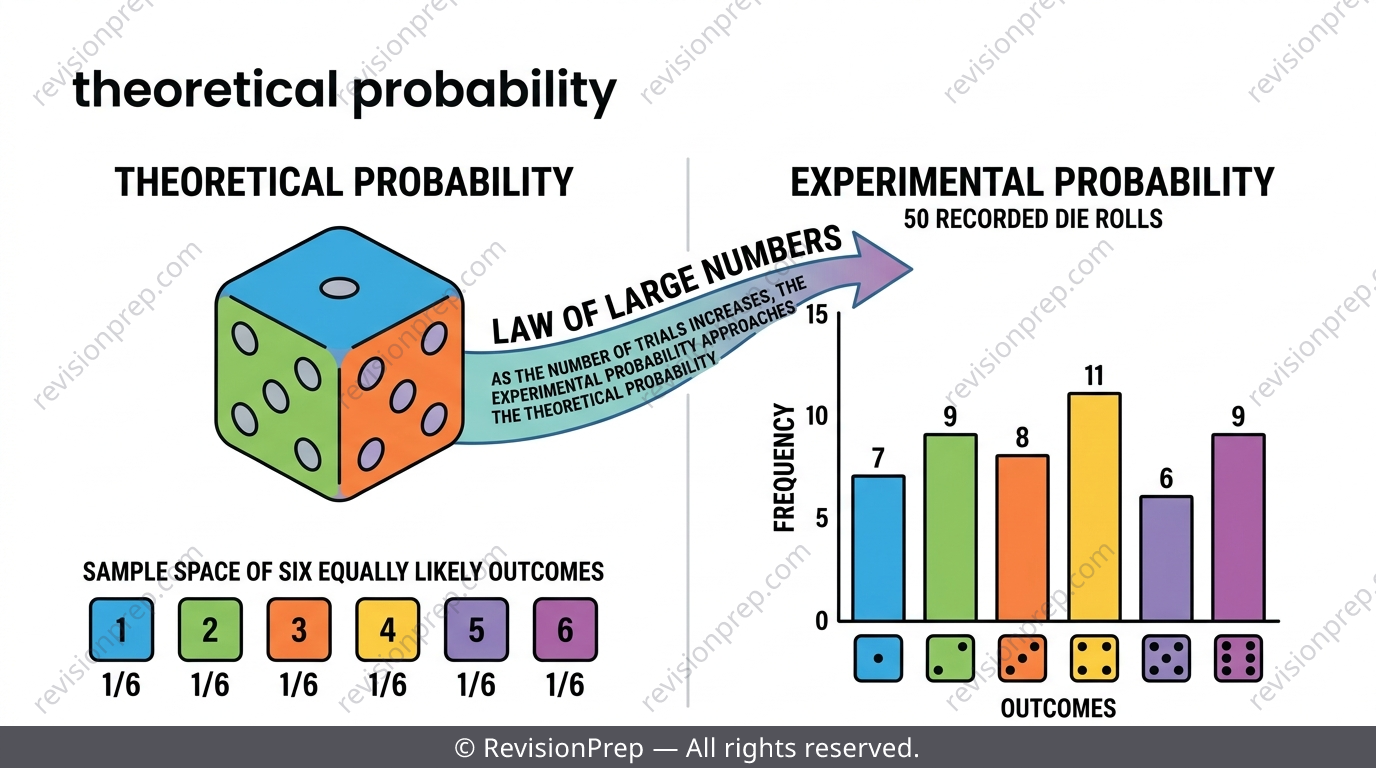
Theoretical probability is worked out before anything happens, just by counting the sample space: . Experimental probability is measured after trials actually run: frequency of the event divided by total trials. The Law of Large Numbers says experimental results drift towards the theoretical value as trials increase — but a small sample, like three 6s in a row, proves nothing about fairness.
| Type | Formula | When to use |
|---|---|---|
| Theoretical | n(E) ÷ n(S) | Before any trial, from equally likely outcomes |
| Experimental | frequency ÷ total trials | After real recorded data |
Exam tip
Underline the keyword before calculating: 'theoretical' means use the sample space formula; 'experimental' or 'from the data' means use the table of results.
Common mistake
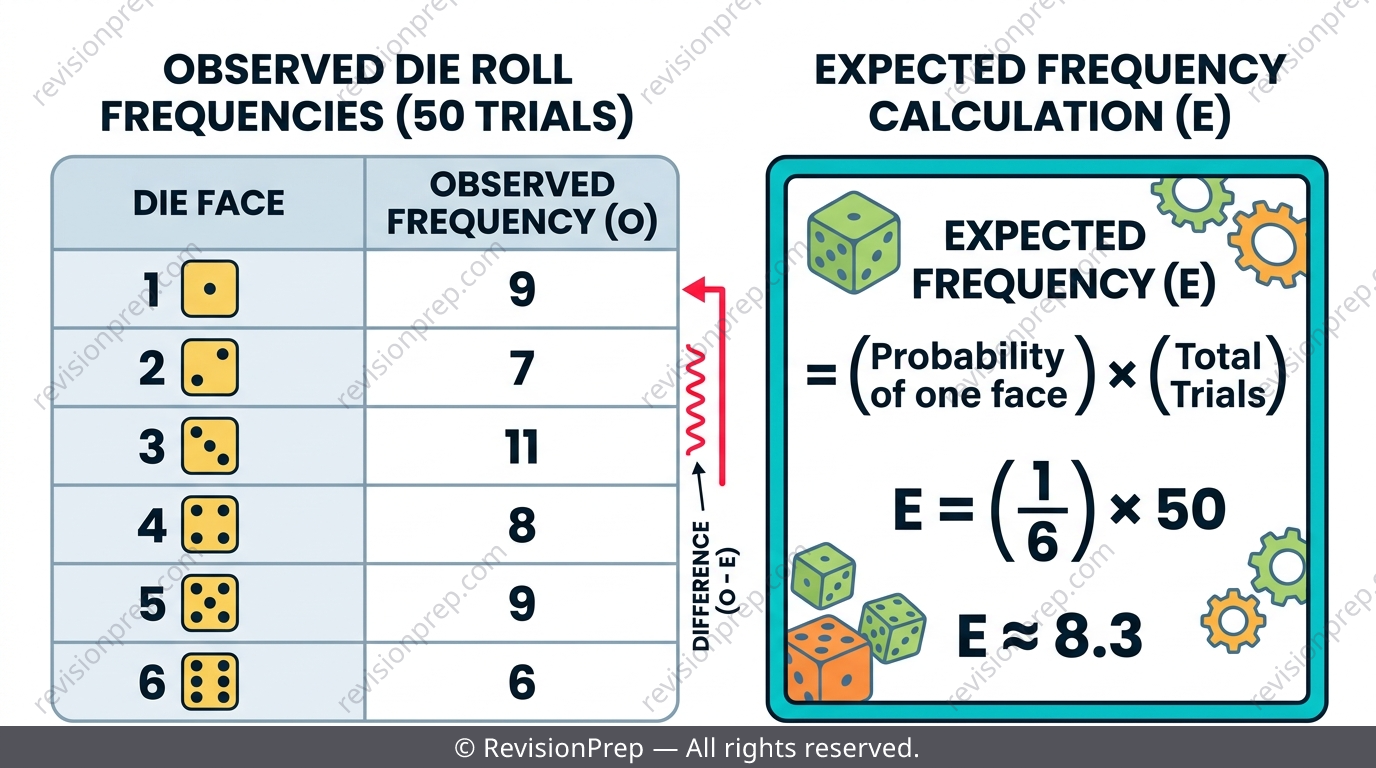
Treating one small experimental result as the true probability and ignoring the theoretical calculation entirely — e.g. quoting P(3) = 7/50 instead of the theoretical 1/6.
Mini summary
Theoretical = counted before trials; experimental = measured after trials; more trials narrows the gap but never guarantees a match.
Single Events vs Combined Events
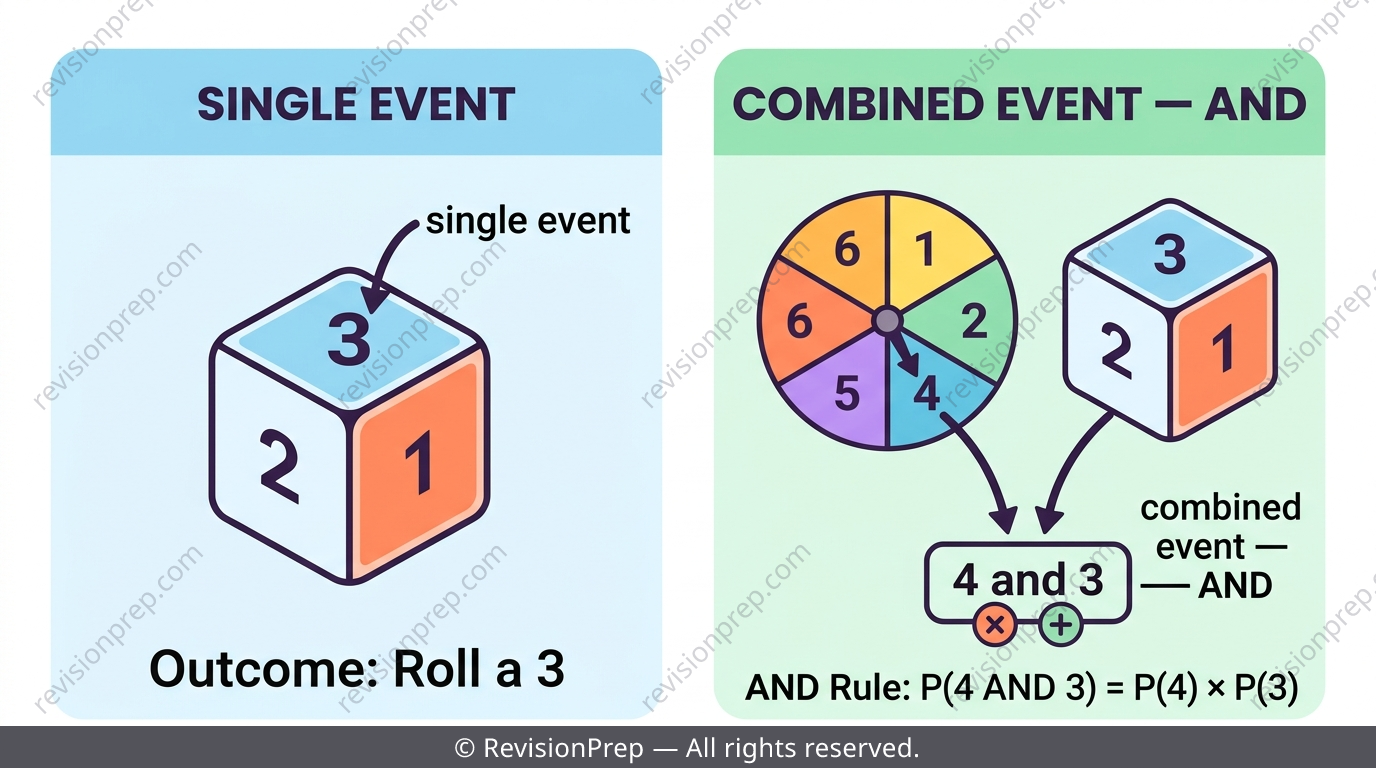
A single event is one action with one outcome recorded, like one die roll. A combined event tracks two or more actions together, like two dice or a spinner and a die at once. For independent combined events use the multiplication rule, ; for mutually exclusive outcomes use the addition rule, .
Exam tip
Circle the connecting word before doing any arithmetic: AND means multiply, OR (for mutually exclusive outcomes) means add.
Common mistake
Adding P(A) and P(B) when the question says 'AND', or multiplying when it says 'OR' between mutually exclusive outcomes.
Mini summary
Single event = one action; combined event = two or more actions treated as one unit — decode AND/OR before choosing an operation.
Dice, Coins and Spinners: Equally Likely Outcomes
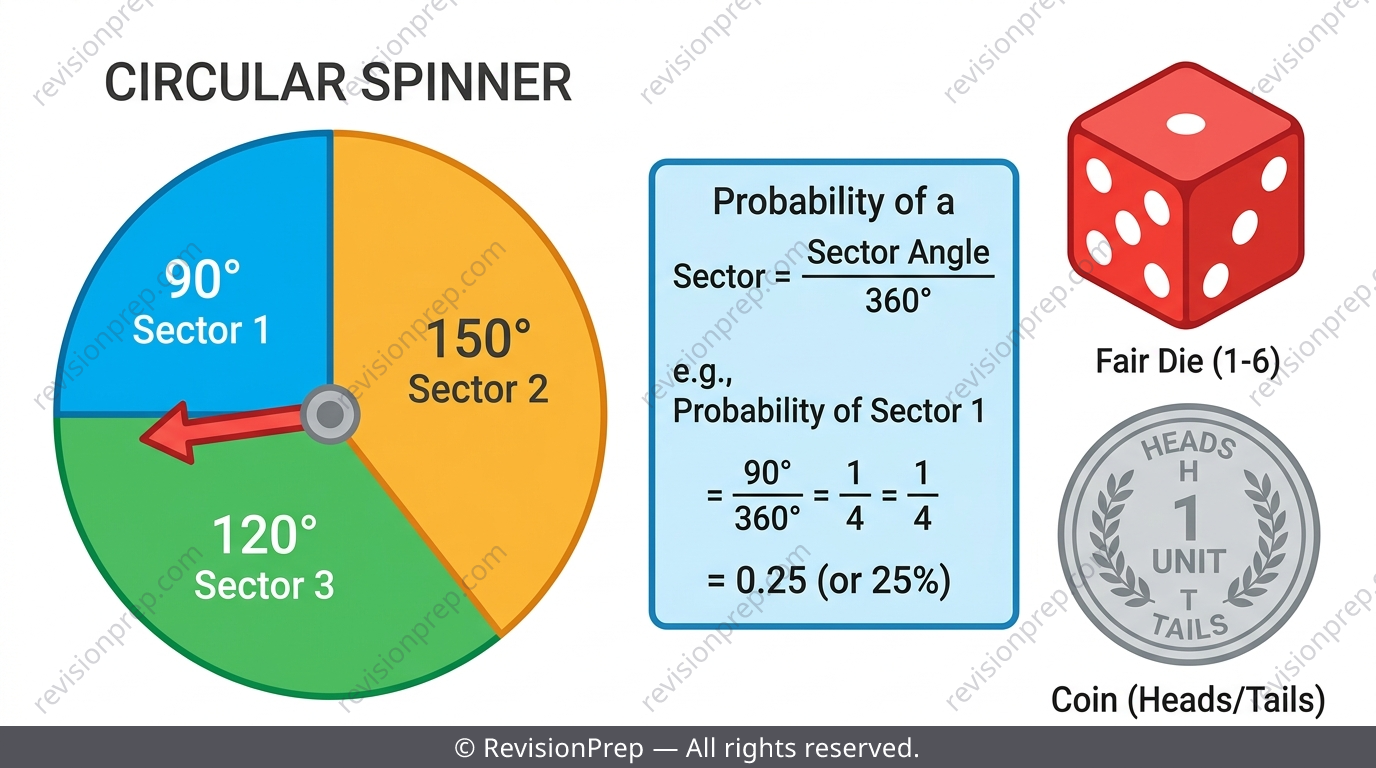
A fair die has 6 equally likely faces, a fair coin has 2, and a spinner with equal sectors has as many equally likely zones as it has sectors — 'fair' and 'equal sectors' are the exact assumptions that make n(favourable)/n(total) valid. When sectors are unequal in size, use instead of 1 divided by the number of sectors. Once wear, weighting or damage is involved, theoretical probability stops being trustworthy and experimental data becomes the better guide.
Common mistake
Assuming a spinner's sectors are all equal in size and calculating 1 ÷ number of sectors, even when the sectors clearly differ.
Mini summary
Dice and coins are automatically equally likely; spinners only are if sectors match in size — otherwise use angle ÷ 360°.
Expected Frequency: A Prediction, Not a Guarantee
Expected frequency is theoretical probability multiplied by the number of trials: . For example, the expected frequency of rolling a 3 in 50 rolls is — and it will not match the observed frequency exactly. That mismatch between expected and observed is exactly what examiners ask you to explain.
Exam tip
When a question asks for 'expected frequency', that always means theoretical probability × number of trials — never a value read straight off a chart.
Common mistake
Reading the expected frequency straight off a frequency table instead of calculating theoretical probability × trials.
Mini summary
Expected frequency = theoretical probability × number of trials — a prediction, not what you'll necessarily observe.
Reading Tree Diagrams for Combined Events
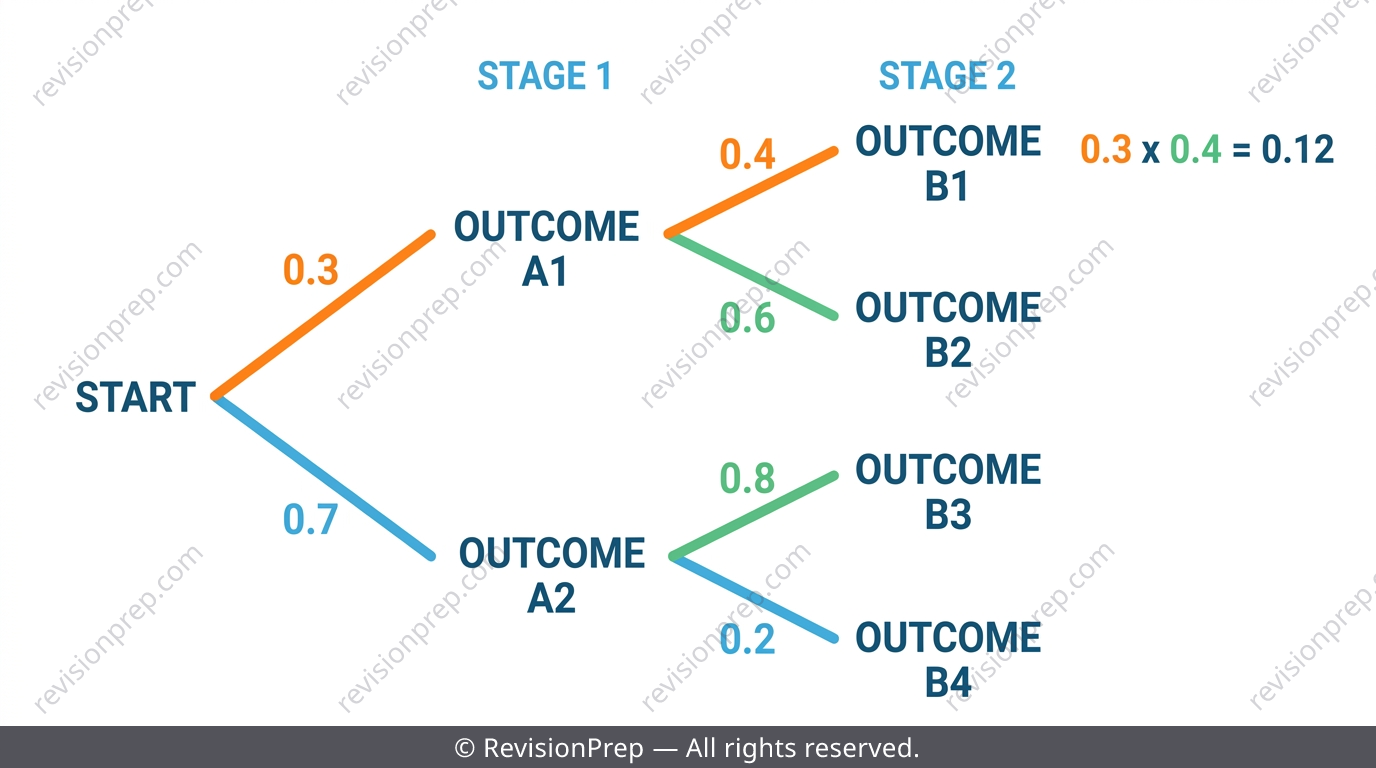
A tree diagram maps combined or sequential events branch by branch, with each branch labelled by its probability. Every complete path from start to end represents one possible combined outcome, and the rule for reading a single path is to multiply the probabilities along it — the same AND logic as the multiplication rule.
Mini summary
Multiply probabilities along a single branch path to find the probability of that combined outcome.
Quick formula sheet
Practice questions
- A fair six-sided die is rolled once. What is the theoretical probability of rolling a 4?
- A coin is tossed 20 times and lands heads 11 times. What is the experimental probability of heads?
- State whether rolling a single die once is a single event or a combined event, and explain why.
- A spinner has 5 equal sectors numbered 1 to 5. Calculate the expected frequency of landing on an odd number in 60 spins.
- A bag contains 4 red, 3 blue and 5 green marbles. Calculate P(blue) as a simplified fraction.
- Two fair coins are tossed together. Use the multiplication rule to find P(two heads).
- A biased coin gives 24 heads in 50 tosses and 48 heads in 100 tosses. Explain what happens to the experimental probability as the number of tosses increases, and why the coin's actual bias does not change.
- A spinner has unequal sectors spanning 90°, 120° and 150°. Calculate the probability of landing on the 90° sector.
- A tree diagram shows a spinner with P(win) = 0.3 followed by a die roll with P(six) = 1/6. Use the tree diagram rule to calculate P(win AND six).
Frequently asked questions
What's the difference between theoretical and experimental probability?+
Theoretical probability is calculated before anything happens by counting the sample space (n(E)/n(S)). Experimental probability is measured after running trials, as frequency of the event divided by total trials performed.
Why doesn't experimental probability always match theoretical probability?+
Small samples can look unfair even from a perfectly fair object. The Law of Large Numbers says experimental probability tends towards the theoretical value as trials increase, but an exact match is never guaranteed.
When do I add probabilities and when do I multiply them?+
Multiply for AND with independent events: P(A and B) = P(A) × P(B). Add for OR with mutually exclusive events: P(A or B) = P(A) + P(B). Circle the connecting word first.
How do I find probability on a spinner with unequal sectors?+
Use each sector's angle divided by 360°, not 1 divided by the number of sectors — that shortcut only works when all sectors are equal in size.
What is expected frequency and how is it different from observed frequency?+
Expected frequency is theoretical probability multiplied by the number of trials — a prediction. Observed frequency is what you actually recorded, and the two rarely match exactly.
Is one unusual result enough to prove a die or coin is biased?+
No. A single unusual run, like three 6s in a row, is evidence but not proof. You need many trials before concluding anything about fairness or bias.
Ready to Master Probability for IB MYP 3?
Related articles