
Physics: Seeing Speed and Distance in Motion Graphs
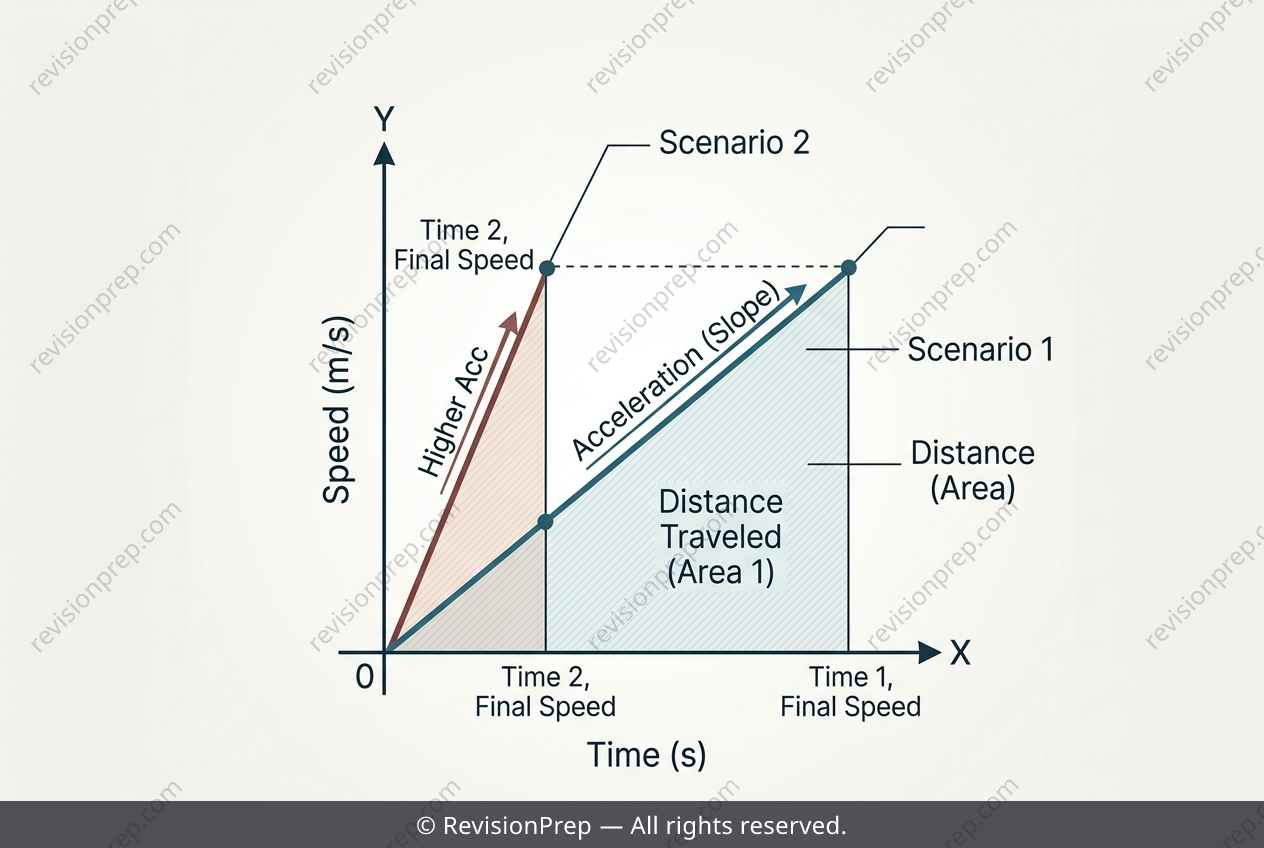
Motion graphs turn abstract kinematics into something you can actually see. A distance-time graph reveals how position changes, with its gradient giving speed, while a speed-time graph shows how velocity evolves, with its gradient giving acceleration and the area beneath it giving distance travelled. Together, these two representations let you move fluidly between a motion's geometry and its equations. This matters because most real motion, from a rocket launch to a braking car, involves changing speed rather than constant velocity. For uniform acceleration, the relationships stay elegantly simple: a = Δv / Δt captures how quickly speed changes, and because the speed-time graph forms a triangle when starting from rest, its area, ½ × base × height, equals the distance covered. The key insight is interconnection: changing the time interval alters acceleration and distance in opposite, predictable ways, since the same speed change spread over less time demands greater acceleration yet covers less ground.
Start practising IB questions today
150,000+ IB-styled questions, criteria-mapped and instantly accessible.