
Maths: Finding the Median from a Stem-and-Leaf Diagram
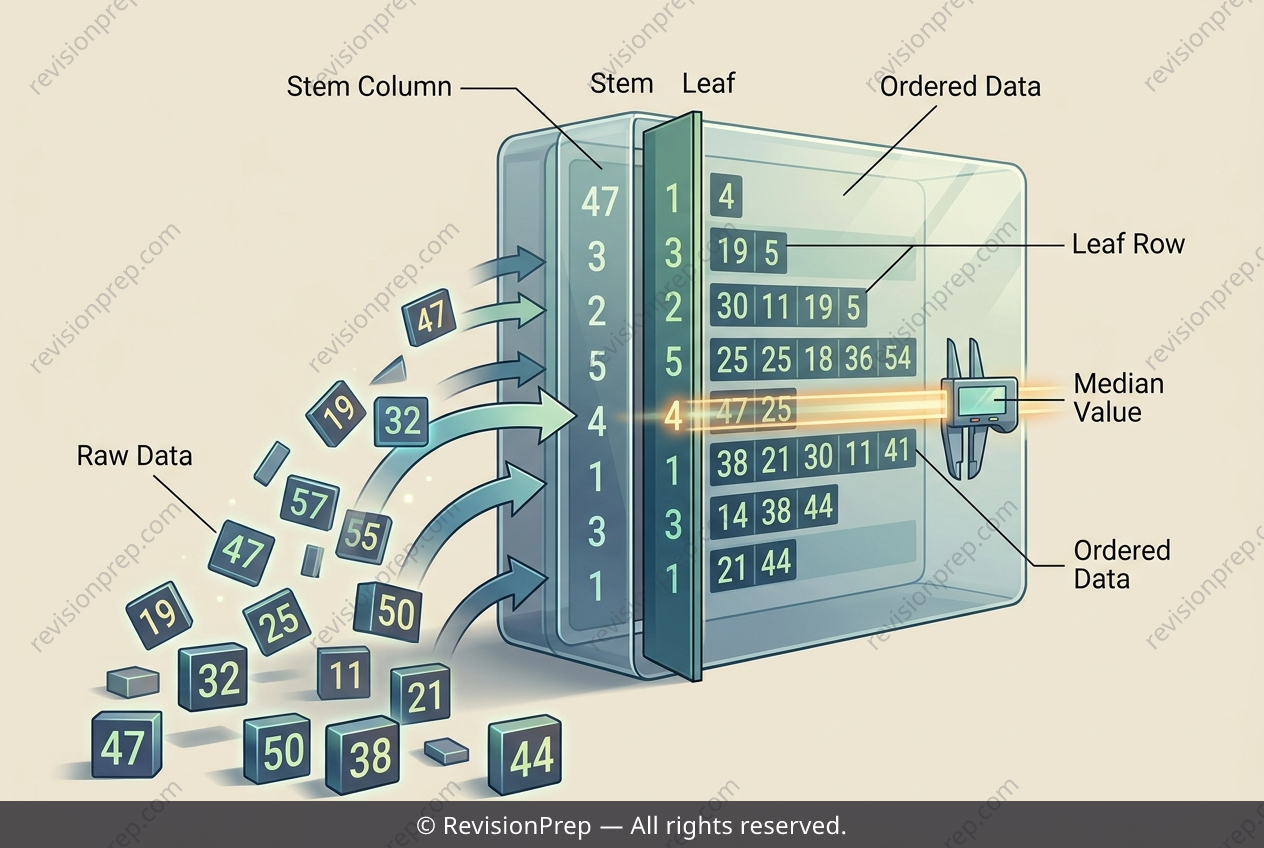
Stem-and-leaf diagrams and dot plots offer a compact way to organise raw numerical data while preserving every individual value. In a stem-and-leaf diagram, each number is split into a stem and a leaf, so a key such as 1 | 2 representing 12 years shows how place value drives the display. This makes the diagram both a table and a rough picture of the distribution's shape. The real power of these displays lies in measuring central tendency. Because the values remain visible and are naturally ordered, the median can be found by locating the middle position rather than averaging every entry. For n values, that position is given by (n + 1) / 2, and counting leaves in order from the lowest stem upwards leads directly to it. This connects the structure of the diagram to the summary statistics that describe the data's centre, spread, and overall pattern.
Start practising IB questions today
150,000+ IB-styled questions, criteria-mapped and instantly accessible.