
Maths: What the Shape of a Stem-and-Leaf Reveals
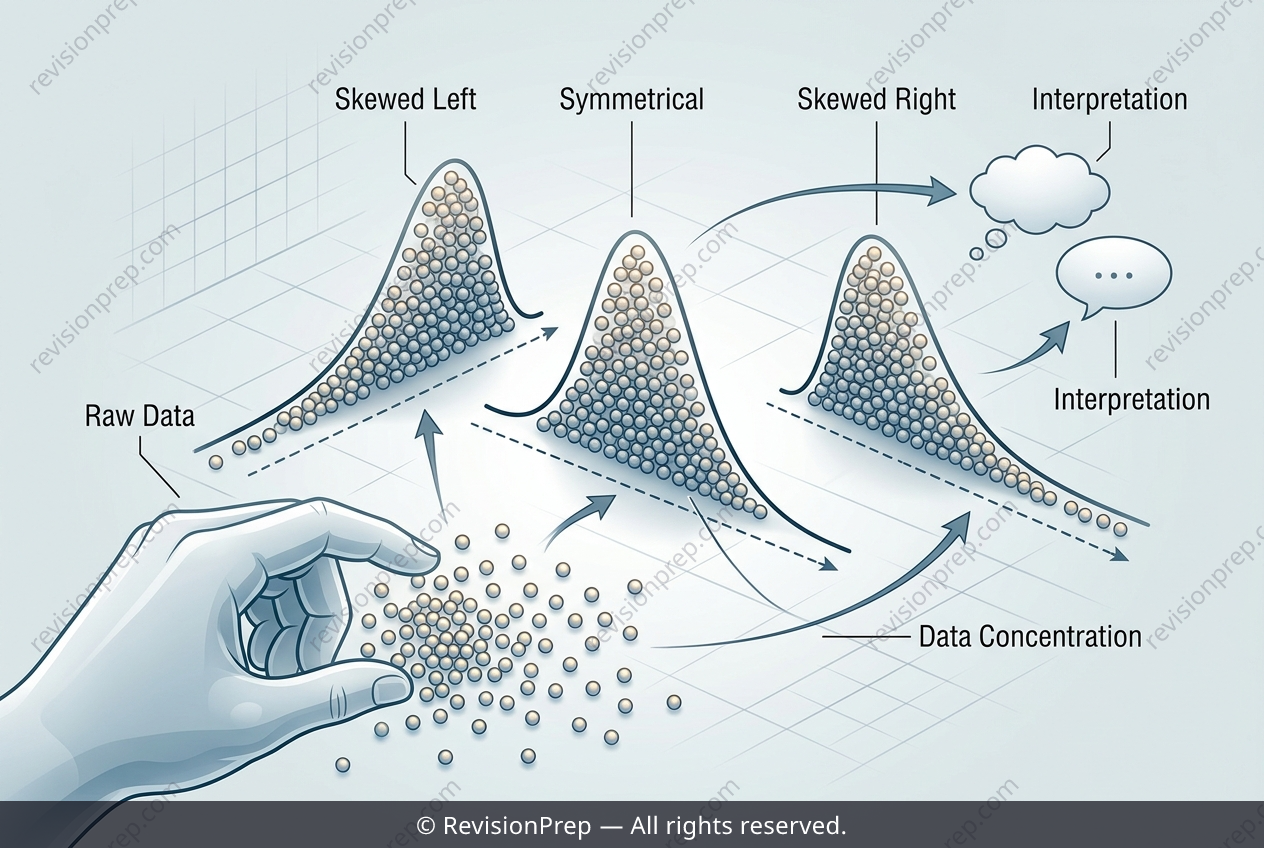
Stem-and-leaf diagrams and dot plots are simple but powerful ways to organise numerical data so that its shape becomes visible at a glance. Each value is split into a stem, usually the leading digit or digits, and a leaf, the final digit, letting every score keep its exact value while still forming an ordered picture. The key explains how to read each entry, so a row such as 5 | 2 represents 52 points. Understanding distribution matters because it reveals far more than a single average ever could. By examining where leaves cluster, where they thin out, and how far the extremes stretch, you can judge whether most students performed similarly or whether a few results sit apart from the rest. Clusters show where the bulk of the data lies, while sparse rows form tails that indicate skew. Comparing counts on either side of a threshold, such as 70, turns that visual pattern into a precise statement about the group, connecting frequency, concentration, and overall performance into one coherent interpretation.
Start practising IB questions today
150,000+ IB-styled questions, criteria-mapped and instantly accessible.