
Maths: How an Ordered Stem-and-Leaf Reveals the Median
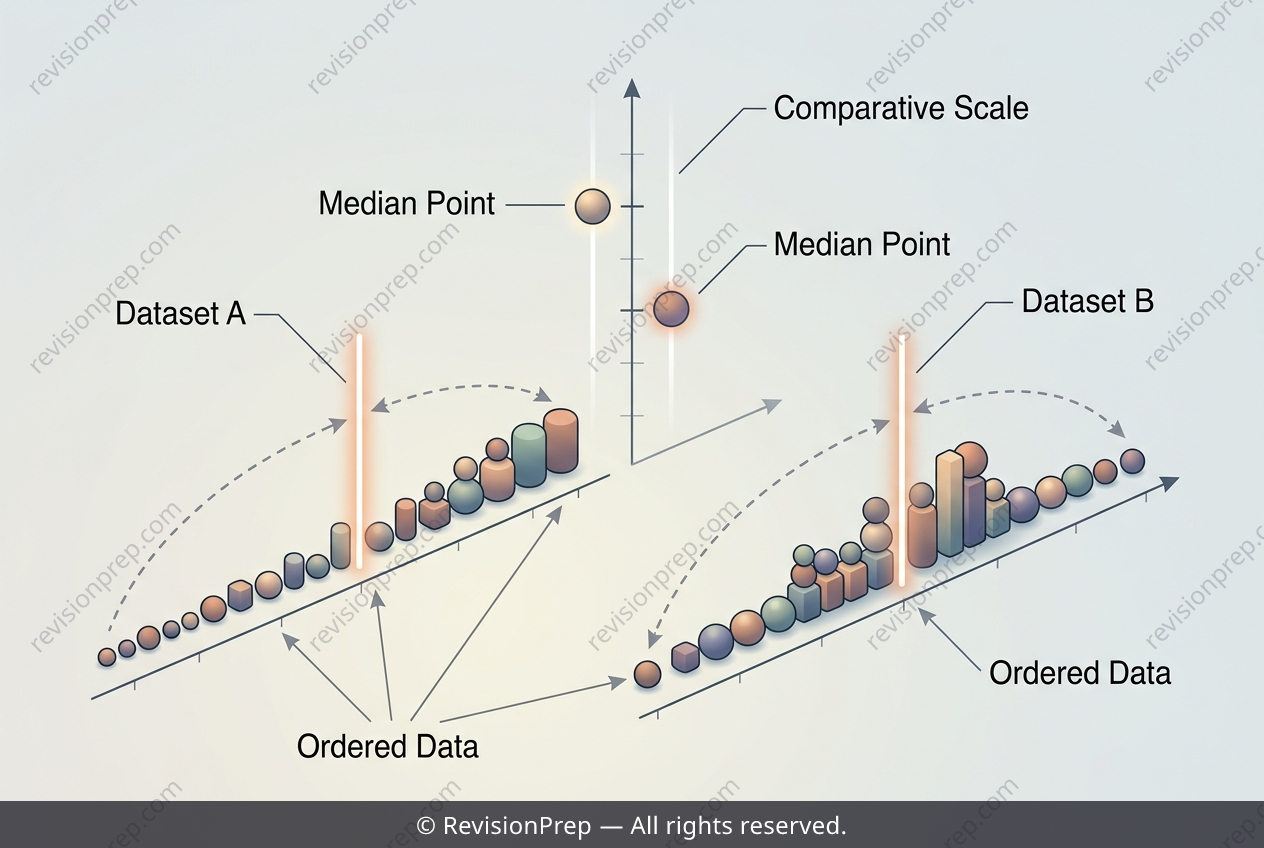
Stem-and-leaf diagrams offer a simple but powerful way to organise numerical data while preserving every individual value. Each number is split into a stem and a leaf, so a diagram can display an entire data set in order without losing the detail that grouped tables hide. This makes such diagrams especially useful for finding measures of central tendency, since the median can be located directly by counting through the ordered values. The median marks the middle of a data set once the values are arranged in ascending order. For n values, its position is given by (n + 1) ÷ 2, and reading to that position in the diagram gives the median age. Because the median describes the centre of a distribution rather than its extremes, it becomes a natural tool for comparing two groups: placing two medians side by side reveals which group tends to be older, younger, or otherwise shifted along the scale being measured.
Start practising IB questions today
150,000+ IB-styled questions, criteria-mapped and instantly accessible.