
Maths: Why Frequency Is Not the Same as Value
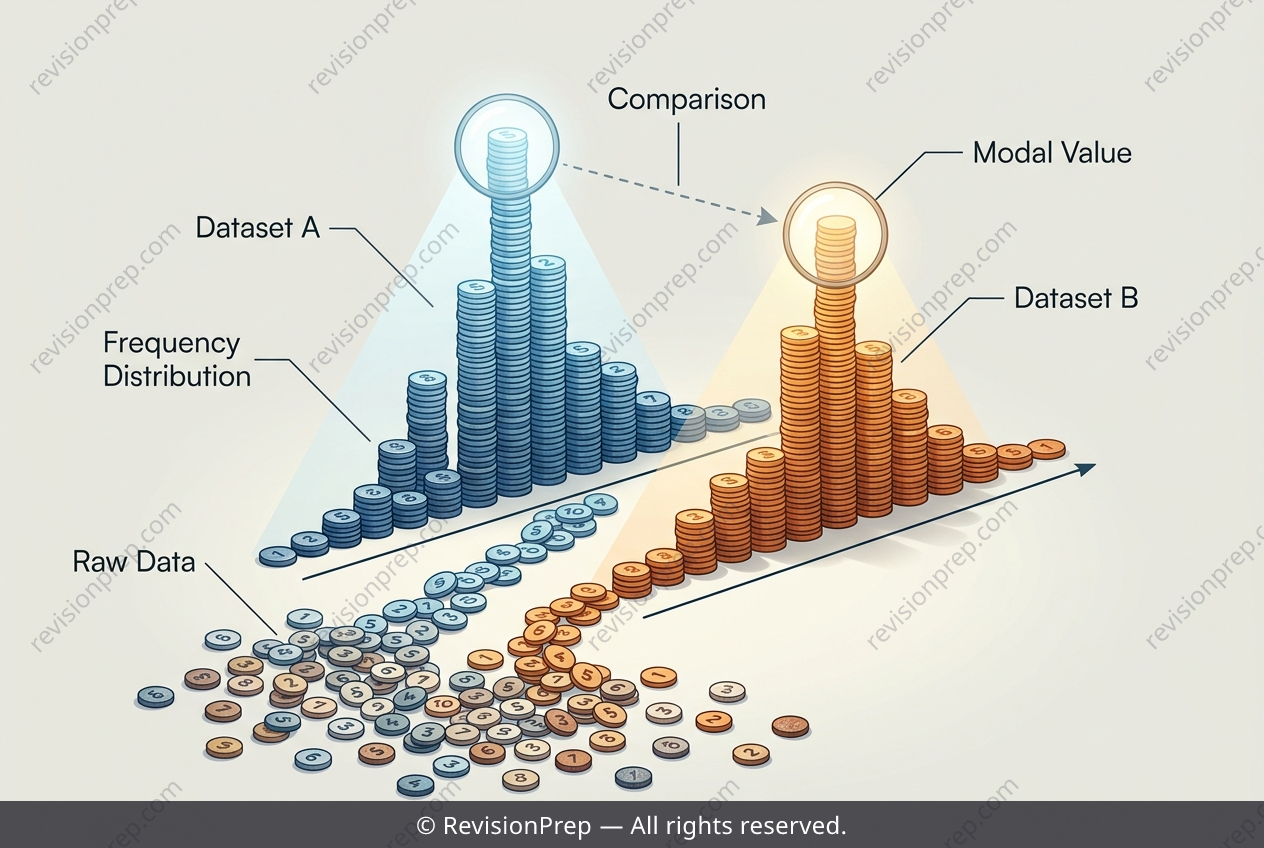
Dot plots and stem-and-leaf diagrams turn raw data into a picture you can read at a glance. Each dot, or each leaf, represents one observation, so the shape of the display reveals how values cluster, spread, and repeat. That repetition is the key idea: the value appearing most often is the mode, and its frequency is simply how many times it occurs. Frequency and value are easy to confuse, so keep them separate. A high column of dots tells you many students share a score, not that the score itself is large. Comparing two data sets therefore means locating each set's highest frequency, reading off the score it sits at, and then comparing those two scores directly. This is how you judge which group performed better on a common measure, and it underpins later work on averages, spread, and distribution shape.
Start practising IB questions today
150,000+ IB-styled questions, criteria-mapped and instantly accessible.