
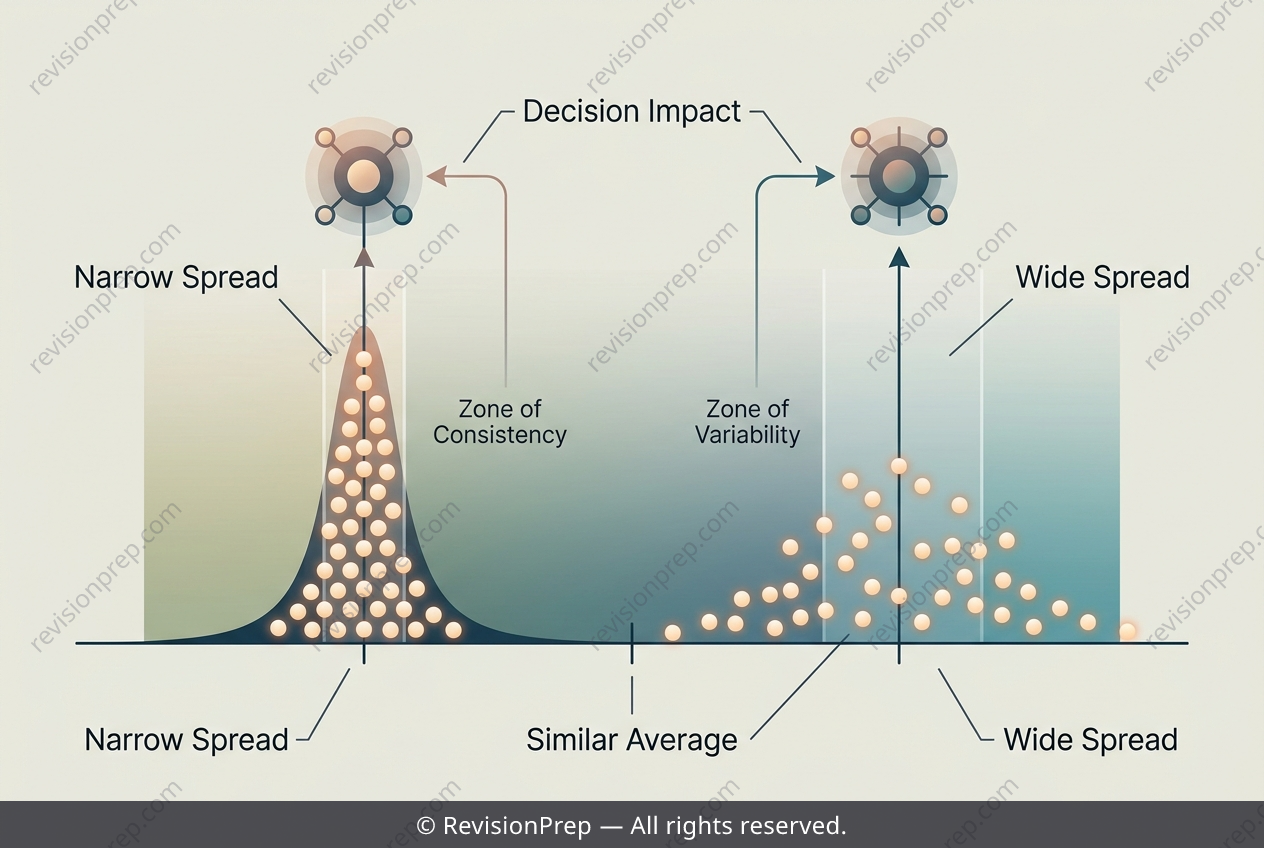
Maths: Why the Mean Alone Is Not Enough
Averages tell you where the centre of a data set sits, but they say nothing about how the data is arranged around that centre. Two classes can share an identical mean number of absences while looking completely different underneath: one where almost everyone misses a day or two, and another where most students miss none but a handful miss six, seven, or eight. Stem-and-leaf diagrams and dot plots expose this hidden structure, letting you read the spread, or dispersion, of values at a glance rather than trusting a single summary number. This matters because central tendency and dispersion answer different questions. The mean tells you what is typical; the range and spread tell you how much variation exists and whether extreme values are pulling the picture out of shape. A narrow spread suggests consistency, while a wide spread signals that some individuals sit far from the average. In real decisions, that distinction changes what you do next, since a class with a few highly absent students points to a targeted problem rather than a general one.
Start practising IB questions today
150,000+ IB-styled questions, criteria-mapped and instantly accessible.