
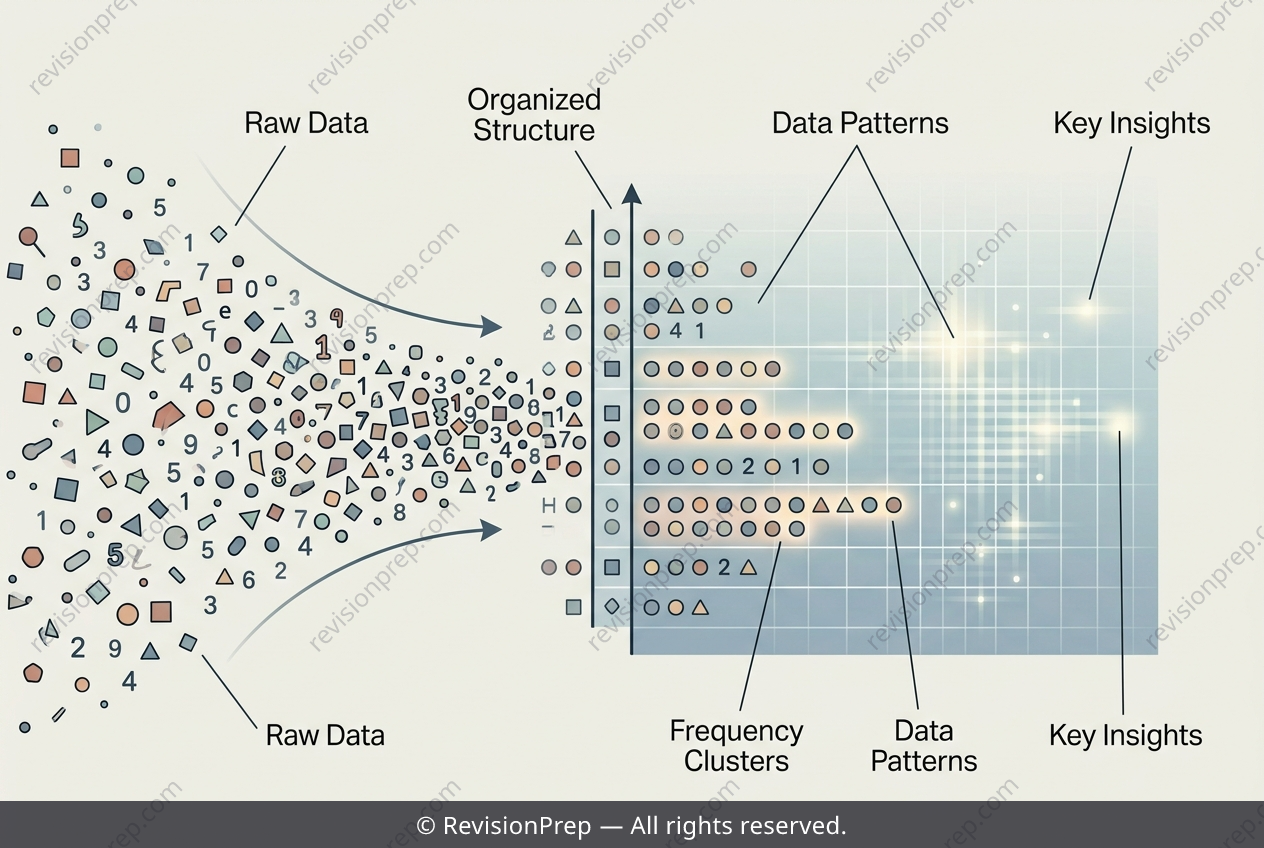
Maths: How Stem-and-Leaf Diagrams Reveal Data Patterns
Stem-and-leaf diagrams and dot plots are simple but powerful tools for organising numerical data while preserving every individual value. A stem-and-leaf diagram splits each number into a stem and a leaf, so a key such as 1 | 2 meaning 12 shows how place value carries the information. Reading across a row reconstructs the original data set, while the shape of the rows reveals the distribution at a glance. This matters because raw lists hide patterns that organised displays expose. Grouping values by stem sorts them automatically, making it easy to spot clusters, gaps, and repeated values. The frequency of any single value is found by counting identical leaves, and the mode is simply the value occurring most often. Comparing counts across rows shows where the data concentrates, while the spread of leaves within each row shows how tightly values cluster. Together, these features turn an unordered set of ages into a clear picture of centre, frequency, and overall distribution.
Start practising IB questions today
150,000+ IB-styled questions, criteria-mapped and instantly accessible.