
Maths: Shift vs Stretch - Transforming a Data Set
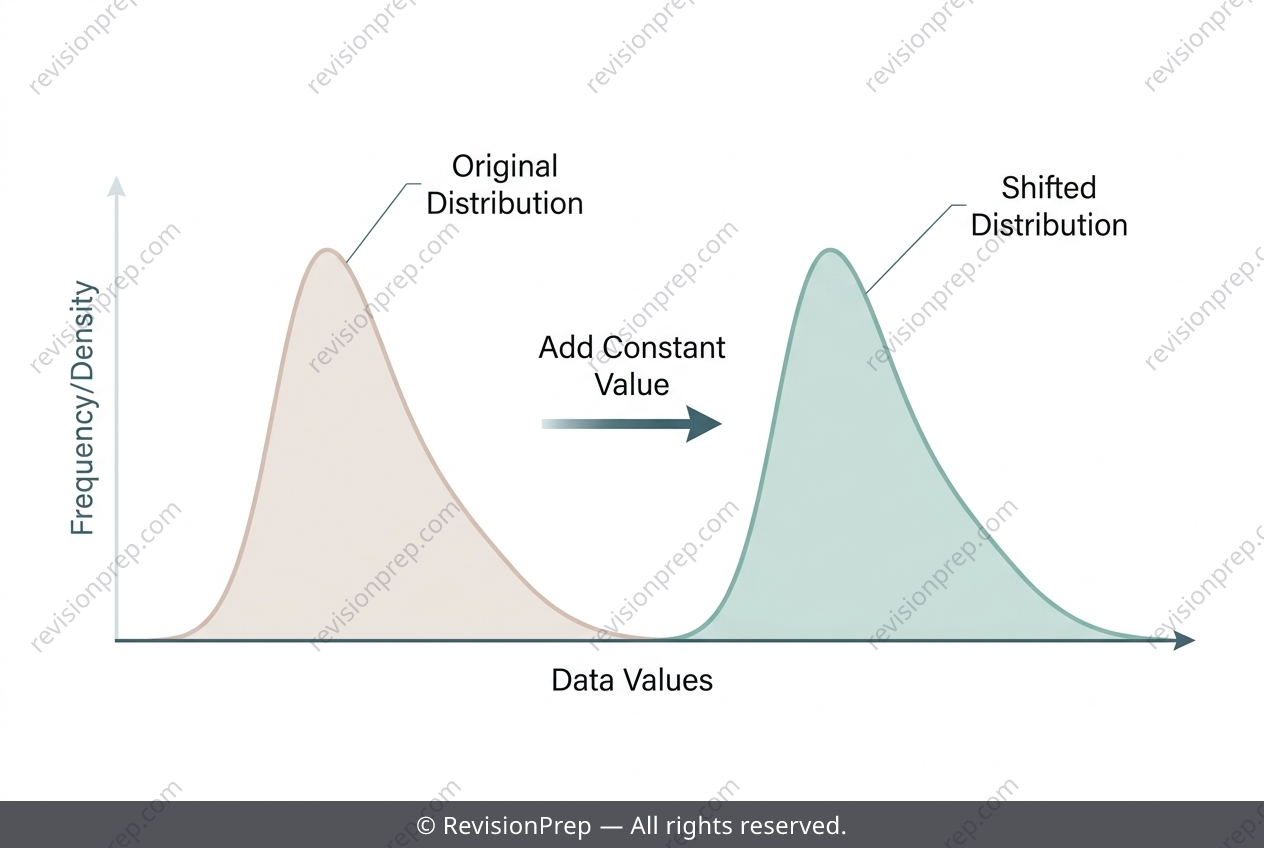
Stem-and-leaf diagrams and dot plots offer a simple but powerful way to see how data is distributed. By splitting each value into a stem and a leaf, they reveal the shape, spread, and clustering of a data set while keeping every original score visible. This makes them ideal for exploring how distributions behave when the underlying values change. Linear transformations are central to this idea. Adding a constant to every score, such as x + 10, shifts each value up by exactly one stem without altering the gaps between values. The leaves per stem stay the same, so the overall shape and spread are preserved — the whole distribution simply translates. Multiplying by a constant would instead stretch or compress the spread. Understanding this distinction helps students connect summary statistics, such as mean and range, to the visual patterns in a diagram, and to predict how a distribution will respond to change.
Start practising IB questions today
150,000+ IB-styled questions, criteria-mapped and instantly accessible.