
Maths: Stem-and-Leaf vs Frequency Tables: Finding Mode
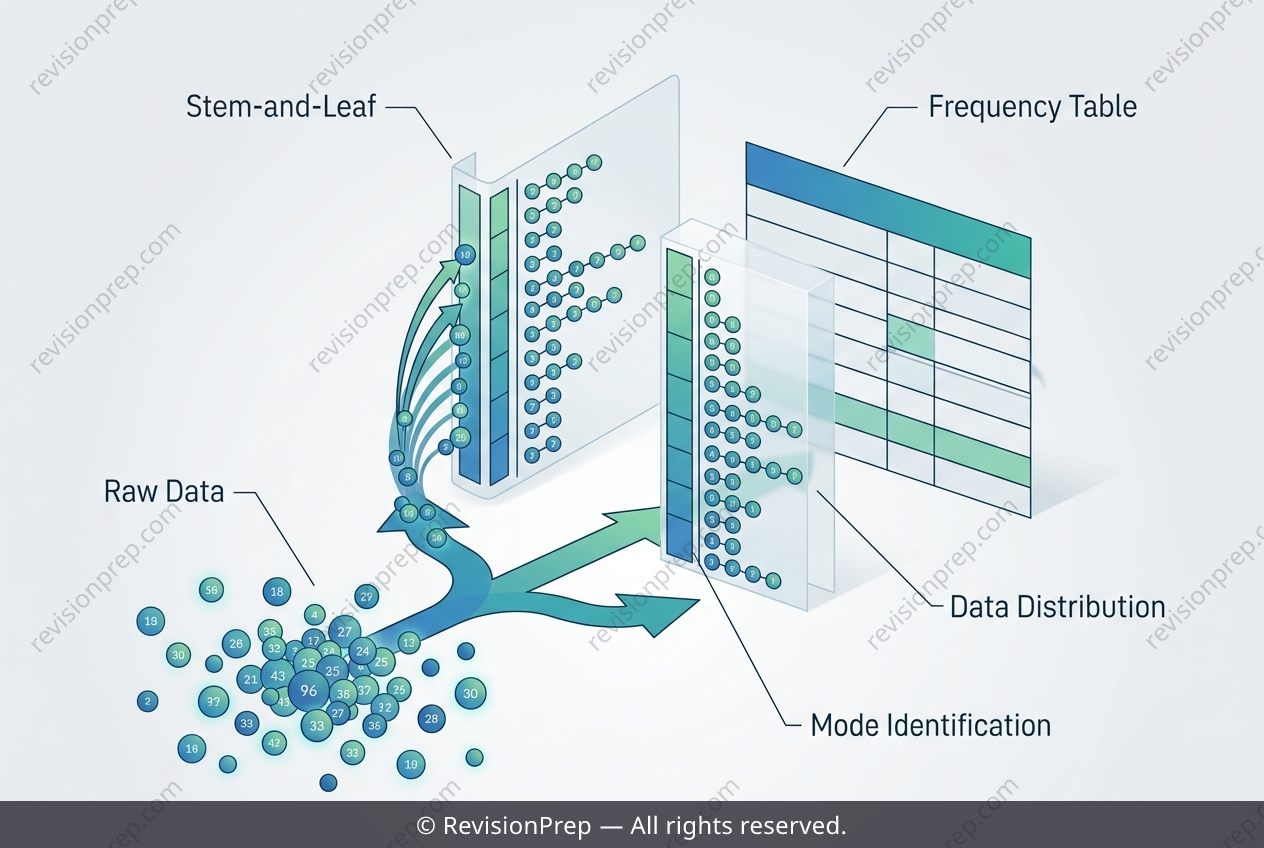
Stem-and-leaf diagrams and dot plots are simple but powerful ways of organising numerical data so that every individual value remains visible while the overall shape of the dataset emerges. In a stem-and-leaf diagram, each number is split into a stem and a leaf — for example, a key such as 1|2 meaning 12 books — so the leaves record the final digit of each value while the stems group values into tens. Reading across the rows reconstructs the full dataset, and the mode is simply the value appearing most often. This matters because choosing the right display changes how easily patterns can be seen. A stem-and-leaf diagram preserves every data value and reveals spread, clusters and gaps, letting you count repeats directly. A frequency table, by contrast, pairs each value with its count, making the most common value obvious at a glance but hiding the individual observations. Understanding this trade-off — detail versus immediate clarity — is central to comparing data visualisations and judging how reliably a single repeated value represents a small sample.
Start practising IB questions today
150,000+ IB-styled questions, criteria-mapped and instantly accessible.