
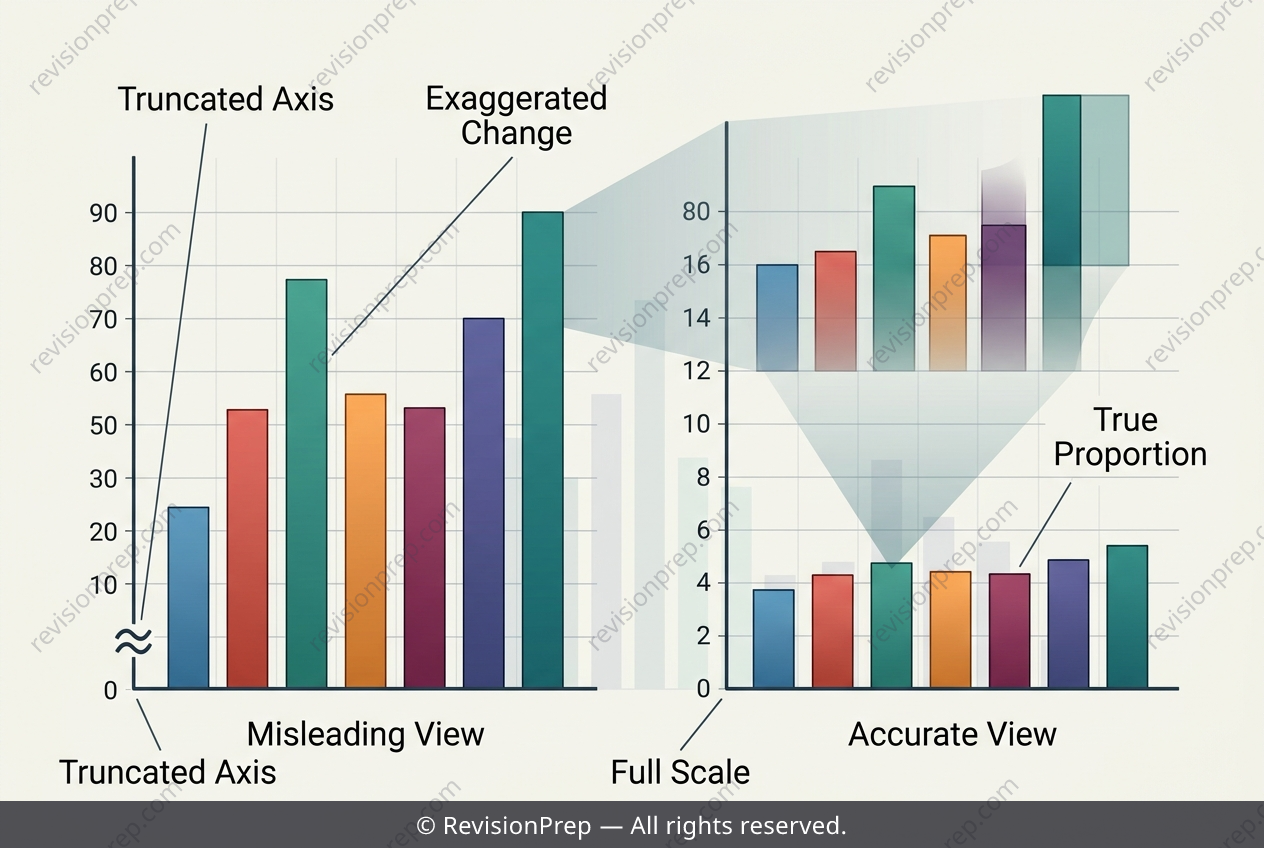
Maths: Why a Truncated Axis Can Double a Bar’s Height
A single graph can tell two very different stories depending on where its vertical axis begins. This is the heart of critically evaluating data representation: recognising that scale choices shape the impression a chart creates, even when every plotted value is technically correct. The concept matters because misleading graphs influence real decisions, from business forecasts to public policy. A truncated axis — one cut short rather than starting at 0 — compresses the visible range, so small changes occupy a large share of the vertical space. A rise from 95 to 105, for instance, can make a bar appear to double in height, even though the underlying increase is modest. The relationship is simple: the smaller the displayed range, the more exaggerated the apparent differences between values. Understanding this connection lets you judge whether a graph informs or distorts, and predict how the same data would look on an honest, zero-based scale.
Start practising IB questions today
150,000+ IB-styled questions, criteria-mapped and instantly accessible.