
Maths: Bar Chart or Histogram? Data Decides
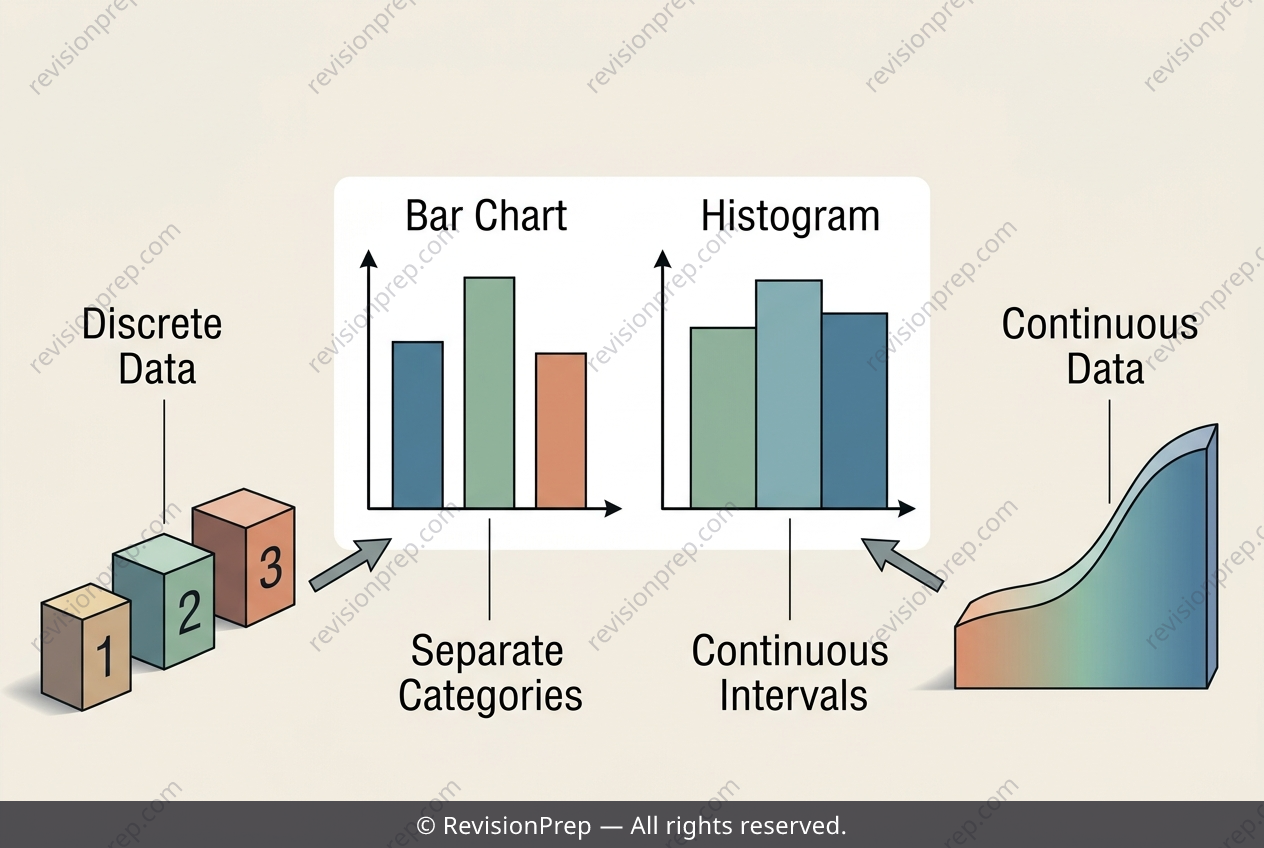
Data classification sits at the heart of statistics: before you can summarise or visualise anything, you must know what kind of data you are holding. Discrete data takes only specific fixed values with gaps between them — shoe sizes such as 5, 5.5, 6 and 6.5 are a perfect example, since a value like 5.3 simply cannot occur. Continuous data, by contrast, can take any value within a range and be measured to any level of precision; a reaction time of 0.245 s could equally be recorded as 0.2451 s or 0.24512 s. This distinction matters because it determines which graph is valid. Bar charts treat each value as a separate category, which suits discrete data but fails for continuous data: because precise reaction times are almost all unique, every bar would represent a single student, hiding any pattern. A histogram instead groups continuous values into equal intervals, or bins, revealing the shape and spread of the distribution. Choosing correctly is therefore not cosmetic — it is what allows genuine patterns to emerge.
Start practising IB questions today
150,000+ IB-styled questions, criteria-mapped and instantly accessible.