
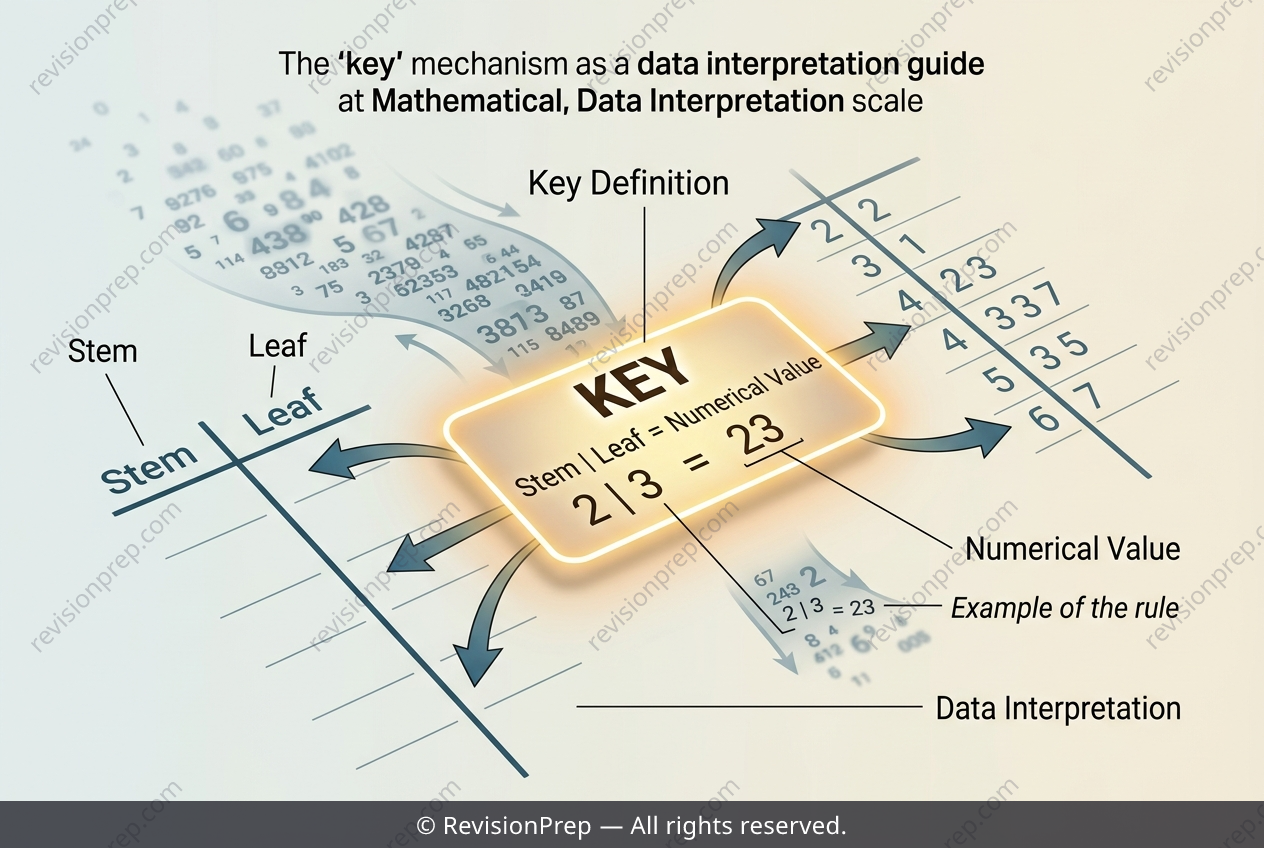
Maths: Decoding Place Value in a Stem-and-Leaf
Stem-and-leaf diagrams and dot plots are simple but powerful ways of organising raw numerical data so that its shape, spread and outliers become immediately visible. A stem-and-leaf diagram splits each value into a stem and a leaf, while a dot plot stacks identical values above a number line, letting patterns emerge without any calculation. Central to reading a stem-and-leaf diagram is the key, which gives one worked example of how a stem and a leaf combine to form a data value, such as 2 | 3 = 23. Without it, the digits are ambiguous: the same display could represent 2.3, 23 or 230. The key therefore fixes the place value of every digit, so each entry can be interpreted correctly and compared meaningfully with the rest of the data set.
Start practising IB questions today
150,000+ IB-styled questions, criteria-mapped and instantly accessible.