
Maths: How Stem-and-Leaf Diagrams Preserve Every Value
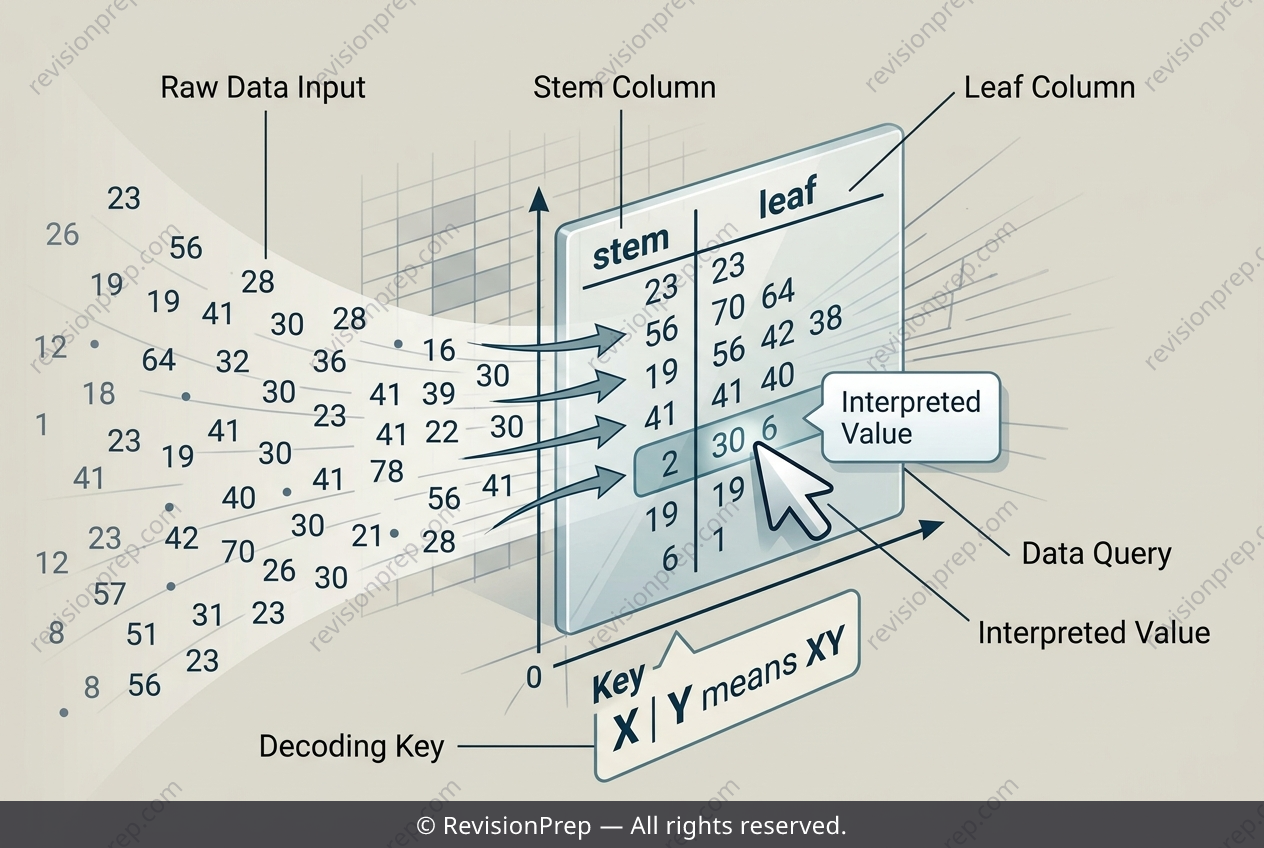
Stem-and-leaf diagrams offer a clever way to display numerical data while preserving every individual value. Each number is split into a stem, usually the leading digit or digits, and a leaf, the final digit, so a key such as 3 | 0 meaning 30 years old tells you exactly how to read the plot. This matters because, unlike a bar chart or histogram, no information is lost through grouping: the shape of the distribution and the exact data points are visible at the same time. The structure is simple but powerful. The stem column lists the tens, and the leaves attached to each stem list the units, arranged in order. Reading a stem-and-leaf diagram therefore becomes a two-step process: locate the correct stem, then scan its leaves. The presence of a particular leaf confirms that value exists in the data set, while its absence confirms that value does not. Counting how many times a leaf appears reveals how many people share that age, connecting the diagram directly to frequency and interpretation.
Start practising IB questions today
150,000+ IB-styled questions, criteria-mapped and instantly accessible.