
Maths: How Tally Marks Make Counting Faster and Easier
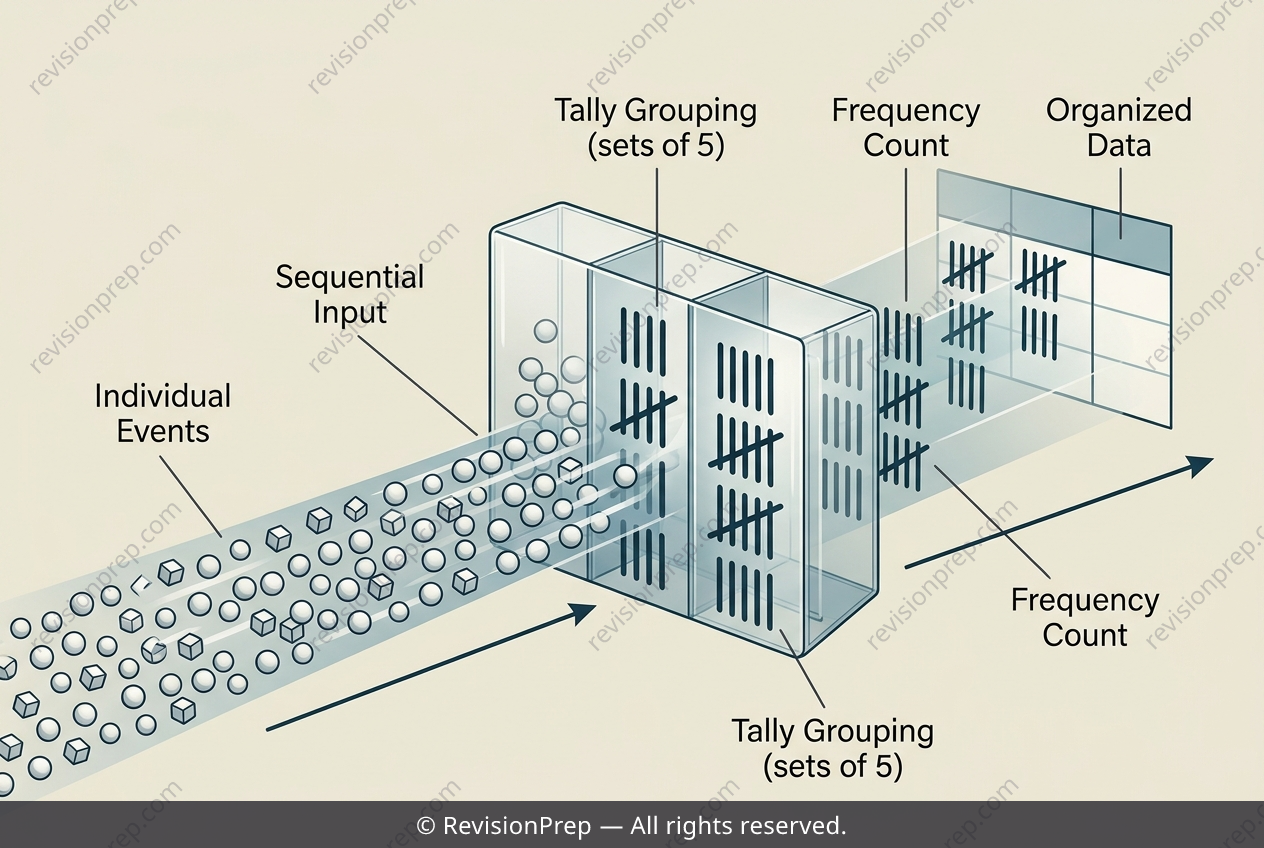
Tally charts are one of the simplest tools for collecting discrete data as it happens. When a librarian records how many students visit the library each day, every visit is marked the moment it occurs, so there is no need to hold a running total in your head. This real-time recording keeps the data accurate and the process quick. The real power of a tally chart lies in how the marks are grouped. Rather than counting individual strokes one by one, tally marks are bundled in sets of five — four vertical lines crossed by a diagonal — so each completed bundle represents five straight away. Totalling then becomes a matter of simple multiplication and addition: count the bundles, multiply by five, then add any leftover marks. This speeds up the process and reduces the chance of counting errors, since mistakes are easier to spot within grouped marks. Together, instant recording and grouping by fives turn raw observations into a frequency table that is fast to build and reliable to use.
Start practising IB questions today
150,000+ IB-styled questions, criteria-mapped and instantly accessible.