
Maths: Median vs Range - Comparing Data Distributions
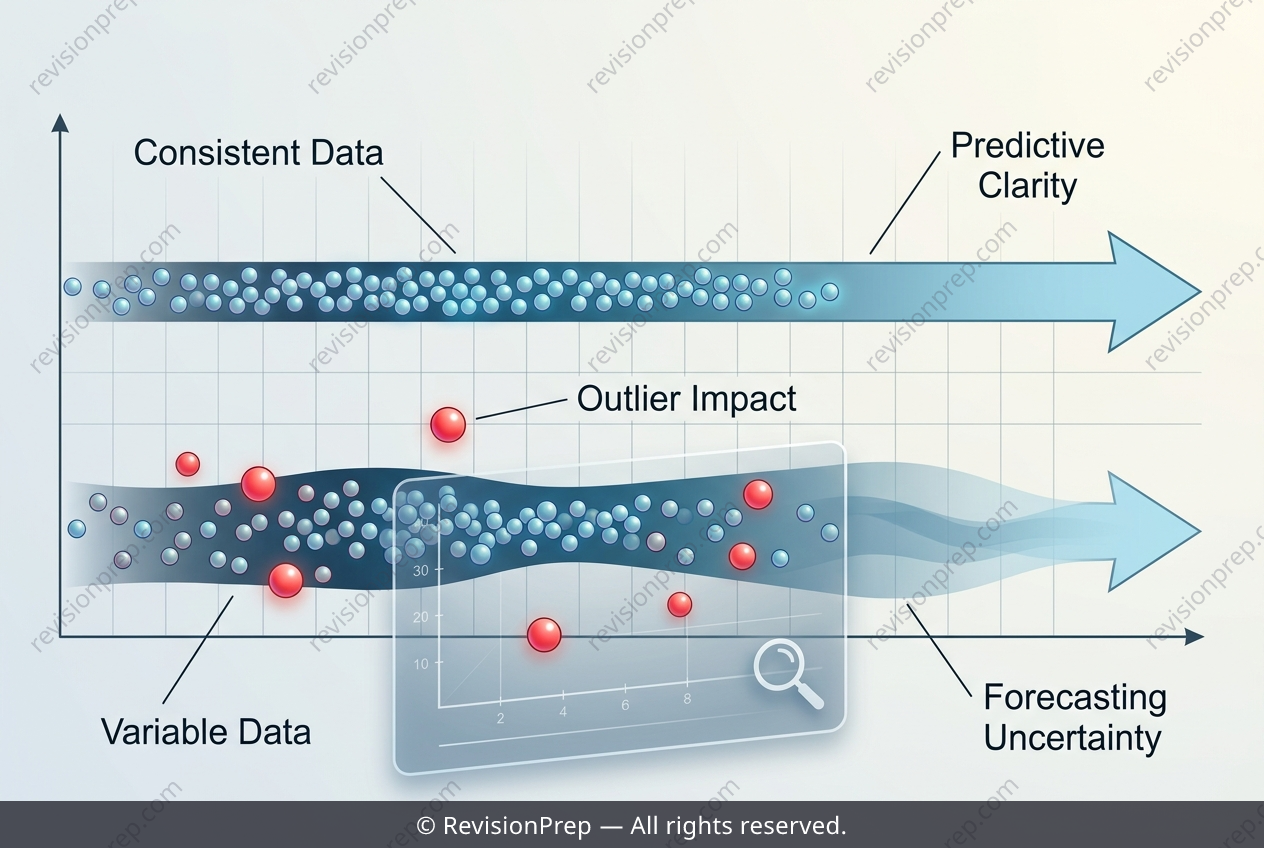
Comparing data distributions is a fundamental skill in statistics, allowing us to move beyond single values and understand the full story behind a dataset. Stem-and-leaf diagrams and dot plots both display every individual data point, making them ideal for comparing two groups side by side. The median identifies the typical value, while the range (maximum minus minimum) captures how spread out the data is. These two measures work together to build a complete picture. A higher median suggests one group typically produces larger values, while a larger range signals greater variability and less predictability. Crucially, extreme values can inflate the range without shifting the median much, so a dataset with outliers may look inconsistent even when most values cluster tightly. Recognising this distinction helps determine which distribution offers a more reliable basis for estimating future outcomes.
Start practising IB questions today
150,000+ IB-styled questions, criteria-mapped and instantly accessible.