
Maths: How to Compare Two Data Sets Correctly
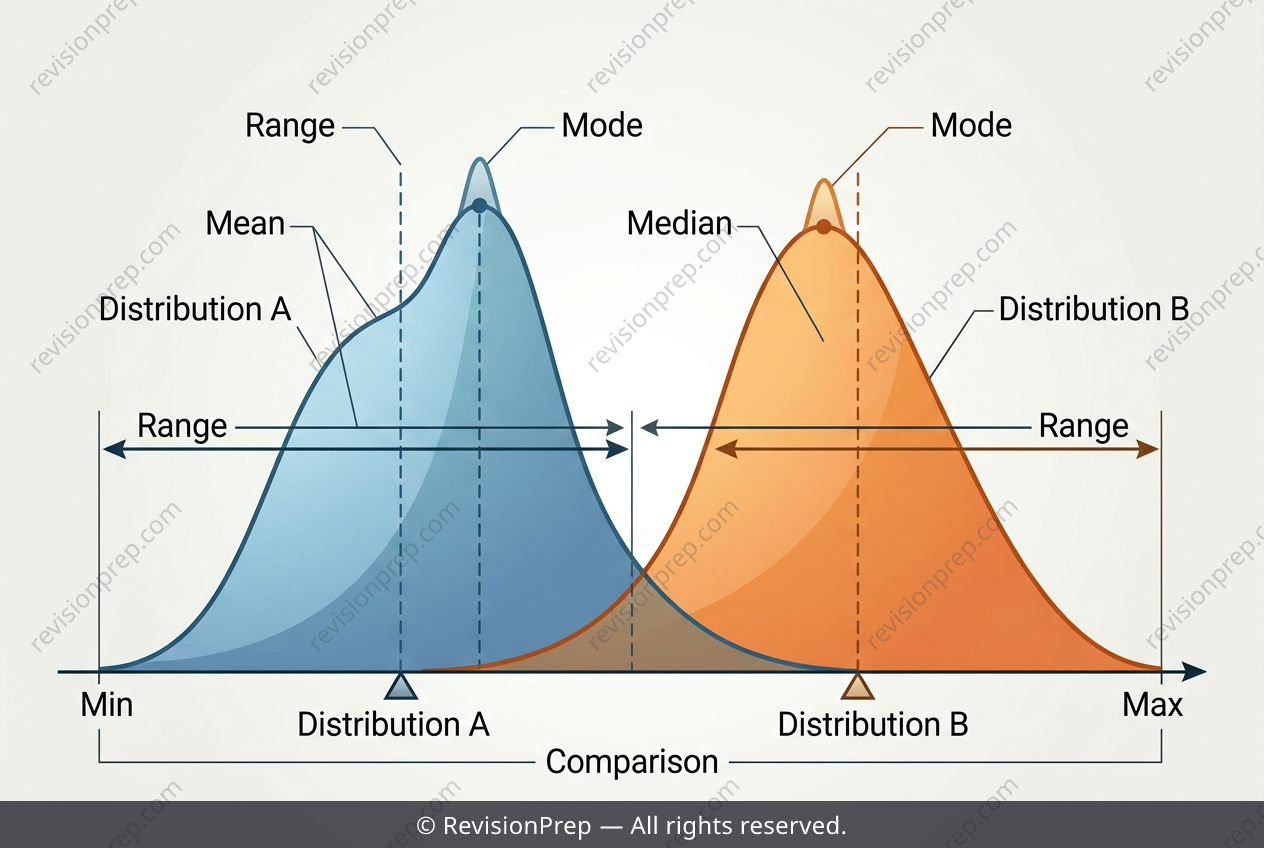
Comparing two sets of data is about far more than deciding which average is bigger. When you place a dot plot or stem-and-leaf diagram for one group beside another, you are reading two distributions at once, and the real story emerges from how their centres and spreads relate. The mean, calculated as the sum of all values divided by the number of values, captures the balance point of a data set, while the median marks the middle value once the data is ordered. The mode shows the most frequent score, and the range, found by subtracting the smallest value from the largest, gives a quick sense of how widely the data stretches. Together these measures answer different questions: where the group typically sits, and how tightly its members cluster. A class can share the same median but differ sharply in consistency, or have a similar range yet very different means. Reading them side by side lets you judge both performance and reliability, which is exactly what comparative analysis demands.
Start practising IB questions today
150,000+ IB-styled questions, criteria-mapped and instantly accessible.